Download
1 / 21
220 likes | 379 Views
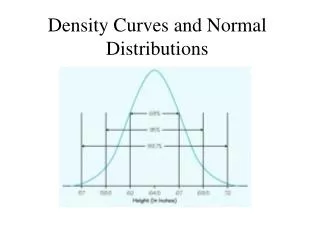
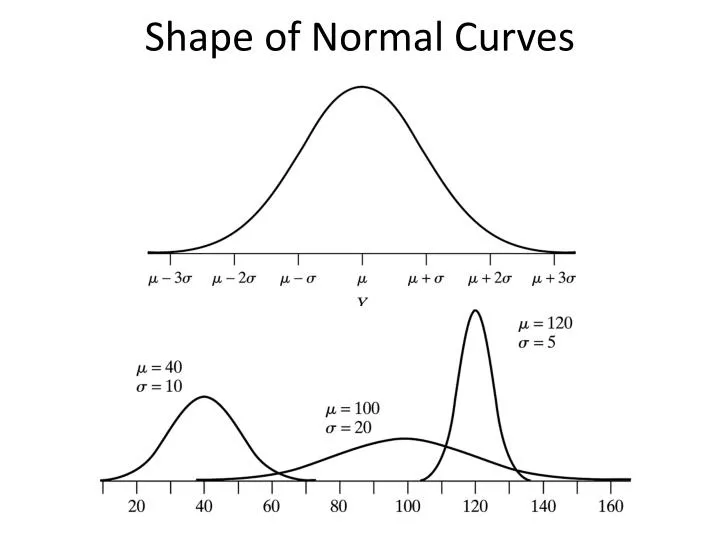
Shape of Normal Curves. Shape of Normal Curves. 68%-95%-99.7% Rule. Areas under Normal Curve. Areas under Normal Curve(cont). Example: Normal Distribution.

E N D
Example: Normal Distribution The brain weights of adult Swedish males are approximately normally distributed with mean μ = 1,400 g and standard deviation = 100 g. (No real life population follows a normal distribution exactly!) a) What is the probability that an adult Swedish male has a brain weight of less then 1,500 g? b) What is the probability that an adult Swedish male has a brain weight between 1,475 g and 1,600 g?
Example: Normal Distribution (cont) μ = 1,400 g and = 100 g a) What is the probability that an adult Swedish male has a brain weight of less then 1,500 g?
Example: Normal Distribution (cont) μ = 1,400 g and = 100 g b) What is the probability that an adult Swedish male has a brain weight between 1,475 g and 1,600 g?
Example: Normal Distribution The brain weights of adult Swedish males are approximately normally distributed with mean μ = 1,400 g and standard deviation = 100 g. (No real life population follows a normal distribution exactly!) c) What is the 55th percentile for the distribution of brain weights?
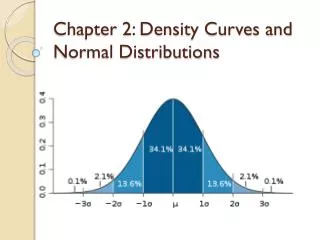
Example (ExDispersion.sas) Determine the percentage of data points within 1 SD? 2 SD?