Download
1 / 27
270 likes | 408 Views
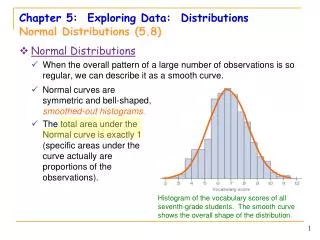
§ 16.1 - 16.2 Approximately Normal Distributions; Normal Curves. Approximately Normal Distributions of Data. Suppose the following is a bar graph for the height distribution of 205 randomly chosen men. Approximately Normal Distributions of Data.

E N D
§ 16.1 - 16.2Approximately Normal Distributions; Normal Curves
Approximately Normal Distributions of Data • Suppose the following is a bar graph for the height distribution of 205 randomly chosen men.
Approximately Normal Distributions of Data • Notice that the graph is roughly ‘Bell-Shpaed’
Approximately Normal Distributions of Data • Now look at the case with a sample size of 968 men:
Approximately Normal Distributions of Data • Here the ‘Bell’ behaviour is more apparent:
Approximately Normal Distributions of Data • Data that is distributed like the last two examples is said to be in an approximately normal distribution. • If the ‘bell-shape’ in question were perfect then the data would be said to be a normal distribution. The bell-shaped curves are called normal curves.
Normal Distributions • Normal curves are all bell-shaped. However they can look different from one another:
Normal Distributions: Properties • Symmetry: Every normal curve is symmetric about a vertical axis.This axis is the line x = where is the mean/average of the data. • Mean = Median
Normal Distributions: Properties • Symmetry: Every normal curve is symmetric about a vertical axis.This axis is the line x= where is the mean/average of the data. • Mean = Median Left-Half50% of data Right-Half50% of data = mean = median
Normal Distributions: Properties • Standard Deviation: The data’s standard deviation, , is the distance between the curve’s points of inflection and the mean.(Inflection pointsare where a curve changes from ‘opening-up’ to ‘opening-down’ and vice-versa.)
Normal Distributions: Properties • Standard Deviation: The data’s standard deviation, , is the distance between the curve’s points of inflection and the mean.(Inflection pointsare where a curve changes from ‘opening-up’ to ‘opening-down’ and vice-versa.) PointsofInflection - +
Normal Distributions: Properties • Quartiles: The first and third quartiles for a normally distributed data set can be estimated byQ3 ≈ + (0.675) Q1 ≈ - (0.675)
Normal Distributions: Properties • Quartiles: The first and third quartiles for a normally distributed data set can be estimated byQ3 ≈ + (0.675) Q1 ≈ - (0.675) 50% 25% 25% Q1 Q3
Example: Find the mean, median, standard deviation and the first and third quartiles. PointofInflection 43 50
Example: Find the mean, median, standard deviation and the first and third quartiles. PointsofInflection 36 39
Example: Find the mean, median and standard deviation. 25% 64.6125 73.875
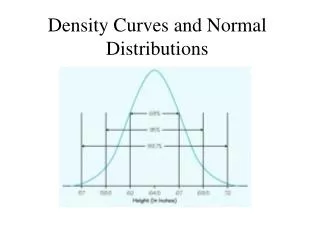
The 68-95-99.7 Rule(For normal distributions) • (Roughly) 68% of all data is within one standard deviation of the mean, .(I.e. - 68% of the datalies between - and + )
The 68-95-99.7 Rule(For normal distributions) • (Roughly) 68% of all data is within one standard deviation of the mean, .(I.e. - 68% of the datalies between - and + ) 68% ofData 16% ofData 16% ofData - +
The 68-95-99.7 Rule(For normal distributions) • 68% of all data is within one standard deviation of the mean, . • 95% of data is within two standard deviations of the mean.(I.e. - between - and + )
The 68-95-99.7 Rule(For normal distributions) • (Roughly) 68% of all data is within one standard deviation of the mean, . • 95% of data is within two standard deviations of the mean.(I.e. - between 95% ofData 2.5% ofData 2.5% ofData - 2 + 2
The 68-95-99.7 Rule(For normal distributions) • 68% of all data is within one standard deviation of the mean, . • 95% of data is within two standard deviations of the mean. • 99.7% of data is within threestandard deviations of the mean.
The 68-95-99.7 Rule(For normal distributions) • 68% of all data is within one standard deviation of the mean, . • 95% of data is within two standard deviations of the mean. • 99.7% of data is within threestandard deviations of the mean. 99.7% ofData 0.15% ofData 0.15% ofData - 3 + 3
The 68-95-99.7 Rule(For normal distributions) 4) The range of the data R is estimated byR ≈ 6
Example:Find the mean, median, standard deviation and the first and third quartiles. 68% 36 52
Example:Find the standard deviation and the first and third quartiles. 84% 6.22 10.35
Example:Find the mean and standard deviation. 2.5% 25 125