Download
1 / 54
580 likes | 955 Views
Population and Resources. This PPT has been adapted from: http://www.slideshare.net/ecumene/population-9-intro-to-population-and-resources-presentation. Contrasting Places. Sudan population density = 15.6 people/km 2. Bangladesh population density = 981 people/km 2.

E N D
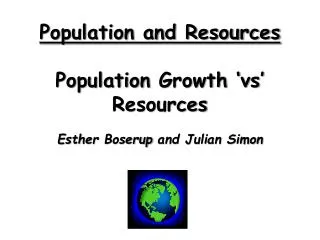
Population and Resources This PPT has been adapted from: http://www.slideshare.net/ecumene/population-9-intro-to-population-and-resources-presentation
Contrasting Places Sudan population density = 15.6 people/km2 Bangladesh population density = 981 people/km2 Which one is over populated?
Contrasting Places Amsterdam (the Netherlands, population density = 397 people/km2) Calcutta (India, population density = 330 people/km2) Which one is over populated?
What does this clip tell us about the relationship (conflict) between people and resources?
Definitions • Over-population– when there are too many people and not enough resources to provide a high standard of living at a given level of technology. • Under-population– when there are not enough people to fully exploit the available resources. • Optimum population – when the population of a country is fully utilizing its available resources and technology to provide the highest standard of living possible. • Carrying capacity – the number of people that can be supported by the available resources within a particular area without the long-term depletion of those resources.
Resources - Key Concepts • Natural resources: environmental: mineral and fossil resources. (i.e.: iron, oil) • Human resources: cultural, economic, technological resources • Non-renewable resources: finite natural resources (oil, coal, gas), capital (machinery, equipment) • Renewable resources: non-finite natural resources: hydro power, wind, solar. • Reserves: Many countries hold “emergency” reserves of finite resources (oil, grain, gas)
Theories on the relationship between population and resources
Starring, from left to right: Thomas Malthus Simon Julian Paul Erhlich Ester Boserup The Club of Rome
Thomas Malthus • 1766-1834. Born in UK. • Wrote ‘An essay on the Principle of population’. Published in 1798 • World pop. in 1798: 9 million people. • Now: more than 6 billion
Malthus recognised that population - if unchecked - grows at a geometric rate: 1 2 4 81632 However, food only increases at an arithmetic rate, as land is finite. 1 2 3 4 5 6
Therefore…. War, famine, disease.
The Core Principles of Malthus: To check = to stop or slow the progress of some unwelcome process. to halt, to stop, to slow something down. Food is necessary for human existence Human population grows faster than the power of the earth to produce food. The effects of these two unequal powers must be kept equal. Since humans tend not to limit their population size voluntarily - “preventive checks” are needed. (in Malthus’ terminology)
Negative checks (decreased birth rate)…. • Negative Checks: limit pop. growth by decreasing birth rate: Examples: abstinence / delay of marriage. • (Malthus favoured moral restraint as a check on population growth. • However, it is worth noting that Malthus proposed this only for the working and poor classes!)
Positive checks (increased death rate) • Positive Checks: events which increase the death rate such as famine, disease, war increasing the mortality rate and reducing life expectancy.
Was Malthus right? ... There has been a population explosion, ... Demand for food is rising rapidly, ... Africa – repeated famines, wars, food crisis, environmental degradation, soil erosion, crop failure and disastrous floods – so was he right?
But….. • Technological improvements which he could not have foreseen • More farmland due to irrigation & better technology • Reduced population growth as countries move through the DTM
The Demographic transition model (DTM) is a model used to represent the transition from high birth and death rates to low birth and death rates as a country develops from a pre-industrial to an industrialized economic system. The theory was developed in 1929 by the American demographer Warren Thompson.
'J' Curve - Population Crash Model This follows the ideas of Malthus: population rapidly expands, reaching the carrying capacity of the land. As the population exceeds this, famine and disease play havoc with the population and it crashes. Where do famine etc. fit?
‘S' Curve - Stabilisation Model This follows ideas of the demographic transition model over time. A low base population is followed by a rapidly expanding one that finally stabilizes at a new high population level.
The Club of Rome • Group of industrialists, scientists, economists and statesmen from 10 countries • Published ‘The Limits to Growth’ in 1972
The Club of Rome – basic conclusion…. • If present growth trends in world population continue and if associated industrialisation, pollution, food production and resource depletion continue unchanged, the limits to growth on this planet will be reached sometime in the next 100 years. • The most probable result will be sudden and uncontrollable decline in both population and industrial capacity.
Malthus and the Club of Rome – are they right?What evidence is there to support their ideas?
Ester Boserup 1965 • Boserup believed that people have resources of knowledge and technology and that “necessity is the mother of invention”, thus as populations grow towards the carrying capacity, peopledevelop new ways to use resources (food) more productively. • Can you think of real life examples?
Thus……. • Demographic pressure (population density) promotes innovation and higher productivity in use of land (irrigation, weeding, crop intensification, better seeds) and labour (tools, better techniques).
Whose view on population growth is this? Ester Boserup
Was Boserup Right? What about resource degradation and pollution? Can we continue to innovate to overcome these issues?
Ehrlich • Paul Ehrlich, a Stanford University biologist, wrote his book The Population Bomb in 1968. • In it he warned of doom and gloom - resource depletion, species extinction and a human population so large that as a species we would face mass poverty, famine, starvation and death. • According to Ehrlich, the Earth had reached its carrying capacity long ago and we were living on borrowed time.
Simon • Julian Simon, a University of Maryland economist, has written several books on population most famously The Ultimate Resource. • Simon thought that all of the doom and gloom of Ehrlich was nothing but nonsense. He claimed that resources are infinite human beings will never run out of them for whatever purpose they decide to use them for. • Essentially, Simon considered humans to be the “ultimate resource”
Thumbs down only means that these are the Neo Malthusians, does not mean the theory is thumbs down… Thumbs up only means that these are the Optimists, does not mean the theory is thumbs up…
Who’s who, and are they or ? = (Neo) Malthusian = “Optimists”
Ehrlich predicted that the prices of resources should increase. Why? Simon countered Ehrlich's saying that in fact the price of resources would decrease over time. Why? versus The Bet
In 1980, Simon offered Ehrlich a bet. Ehrlich could choose any five raw materials he wanted. Simon sold Ehrlich an option to buy an amount of each raw material worth $200 in 1980 dollars. If the prices increased over the next ten years, Simon would pay Ehrlich; however, if the prices decreased over the same time period, Ehrlich would have to pay Simon.
Ehrlich chose five metals: copper, chrome, nickel, tin and tungsten.
Ten years later, after adjusting for inflation, the prices of all five metals…….
Ehrlich had lost. He sent Simon a cheque and nothing else. Simon offered to bet again and up the ante to $20,000; Ehrlich declined. Interesting further reading: http://en.wikipedia.org/wiki/Simon-Ehrlich_wager
Let's apply Simon's logic to another commodity, petroleum. In 1980 the price of a barrel of sweet crude oil was approximately $32. By 1990, the price had fallen to $20 per barrel. According to Simon’s logic this would mean that we have more oil than we had before and that we weren't running out of oil. Is this the case??