Download
1 / 27
270 likes | 373 Views
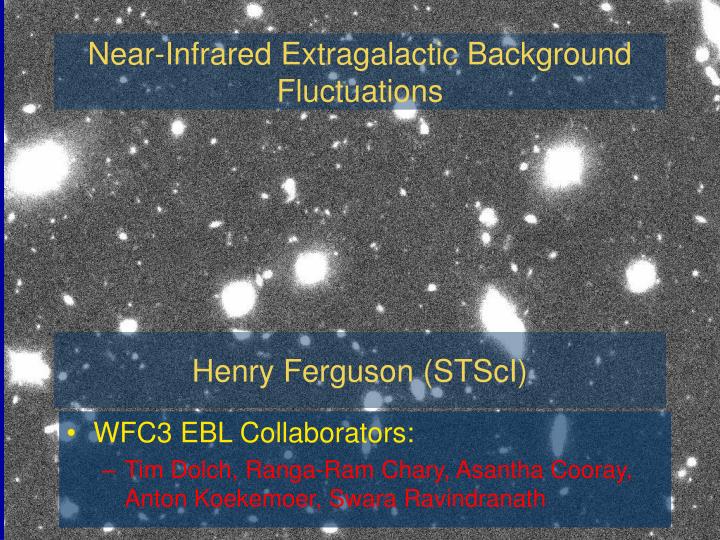
Near-Infrared Extragalactic Background Fluctuations. Henry Ferguson (STScI). WFC3 EBL Collaborators: Tim Dolch, Ranga-Ram Chary, Asantha Cooray, Anton Koekemoer, Swara Ravindranath. WFC3 H-band masked. Background. We have resolved 30-100% of the EBL We do not know how much is due to:

E N D
Near-Infrared Extragalactic Background Fluctuations Henry Ferguson (STScI) • WFC3 EBL Collaborators: • Tim Dolch, Ranga-Ram Chary, Asantha Cooray, Anton Koekemoer, Swara Ravindranath
Background • We have resolved 30-100% of the EBL • We do not know how much is due to: • The wings of galaxies • The faint end of the LF post reionization • Sources at the epoch of reionization • The night sky is bright compared to galaxies! Galaxies Adapted from Leinert 1998 Bock+ 06
Fluctuations in the Near-IR from HST • Thompson et al HST NICMOS: • Detected sources emit 7 nW m2 sr-1 compared to DC-level estimate of 70 nW m2 sr-1 from Matsumoto+ 2005 • Sources of the remaining fluctuations are probably at z<8 (even for the longer-wavelength IRAC data).
Data Preparation • Iteratively remove detector blemishes • Combined dithered images with some masking • Transfer combined image back to original image geometries and subtract • Smooth and detect blemishes or persistence • Mask and recombine for the final image • Create pure noise images in original detector coordinates • Gaussian statistics okay for these images; match sky background • Predicted RMS matches measured RMS to within a few percent • Combine these just as for the real images • Mask the detected sources • Ideally -- subtract the galaxy wings (work in progress)
Analysis Procedure • Create a shuffled version of the image • Unmasked pixels are randomly shuffled, removing correlations • For both the shuffled and unshuffled version: • Convolve the masked images with kernels of various sizes • Compute the histogram of pixel intensities P(D) • Subtract the shuffled P(D) from the unshuffled P(D). • Excess is amplified when kernel matches the characteristic size of the sources
Simulated data α=0.1,r=0.12” α=0.1,r=0.36” α=0.5,r=0.12” α=0.5,r=0.36”
Validation • Tests on simulated UDF data • Pure Gaussians: • Recover power-law slope to about σα=0.1 • Recover size to about 10% • (for an idealized model with Gaussians all the same size) • Mixture of galaxy profiles: • power-law biased low by -0.1 ± 0.1 • Characteristic size biased high by 1.2 ± 0.2
Preliminary results • Simple power-law model: • N(M)~10αm • Normalization fixed to match total counts 27<m<28 • Constant size modeled with Gaussians • Best fit • F105W: α = 0.7, r = 0.24’’ • F125W: α = 0.65, r = 0.24’’ • F160W: α = 0.65, r = 0.24’’ • Steep slope is intriguing
Near-IR Galaxy counts • Faint-end slope is: • Much flatter than α=0.6 • Similar in all three bands • Less than 5% of the galaxies at H>26.5 are identified as Lyman-break galaxies at z>6.5
Correlations between bands Correlation after convolution with 4-pixel (0.24”) Gaussian Simulated data – identical colors for all galaxies
Future Efforts • Galaxy subtraction • More sophisticated models • Galaxy size magnitude relation with scatter • Galaxy redshift and SED distributions • Better calibration of hot pixels and persistence • More data
Hubble Multi-Cycle Treasury Program • WFC3 IR observations of 5 well-studied reference fields at high galactic latitude: • The GOODS fields • Encompass the deepest fields from HST, Spitzer, Chandra, the VLA, and soon Herschel • Carefully selected portions of • The Extended Groth Strip • the COSMOS field • The UKIRT Ultradeep Survey Field • Optimized for studies of galaxy evolution at z~2-10 • Optimized for supernova cosmology Theories crumble, but good observations never fade.— Harlow Shapley
Observing strategy • Wide fields: • ~750 sq. arcmin (44-45 tiles) • 2/3 orbits J (F125W) • 4/3 orbits H (F160W) • GOODS Deep: • ~130 sq. arcmin • 11 orbit depth 3+4+4 • F105W+F125W+F160W • At least 12 orbits new ACS F814W • UV (GOODS-N): • ~70 sq. arcmin • Lyman-escape fractions at z~2.5 • 2.6:1 ratio in F275W:F336W
Potential for EBL measurements • HST Multicycle treasury program will cover 830 square arcminutes at 1.2 and 1.6 microns to 27-28 magnitude • Fluctuation measurements on larger scales will be possible • The large angle (θ ~ 1/30 °) peak (green curve) is a linear-theory prediction of clustering of reionization sources. • Small scale power is sensitive to the slope and normalization of the luminosity function and the sizes of the sources. • large area surveys with WFC3 can (barely) reach large angle peak Reionization Simulation from Trac and Cen 2007 Large θ Small θ
Summary • A new technique for analyzing the small-scale structure in the EBL: • Fit difference of P(D) and shuffled P(D) after convolving with a kernel • Constrains both the number-counts slope and the power-law index 1-2 mag fainter than detection limit. • Preliminary analysis suggests fluctuations well in excess of extrapolation of observed counts • In Y, J and H bands. • Unlikely to be reionization sources • Possible systematic effects remain • Wings of galaxies; persistence