Download
1 / 1
10 likes | 84 Views
Understanding of the East (Japan) Sea Circulation by using Altimeter, ARGO and SST. Young Jae Ro, Eung Kim, and Yong Hoon Youn * Chungnam National University, Yusung-gu, Gung-dong 220, Daejon, Korea, 305-764 * Meteorology Research Institute, KMA, Seoul, Korea , 157-720. Introduction.

E N D
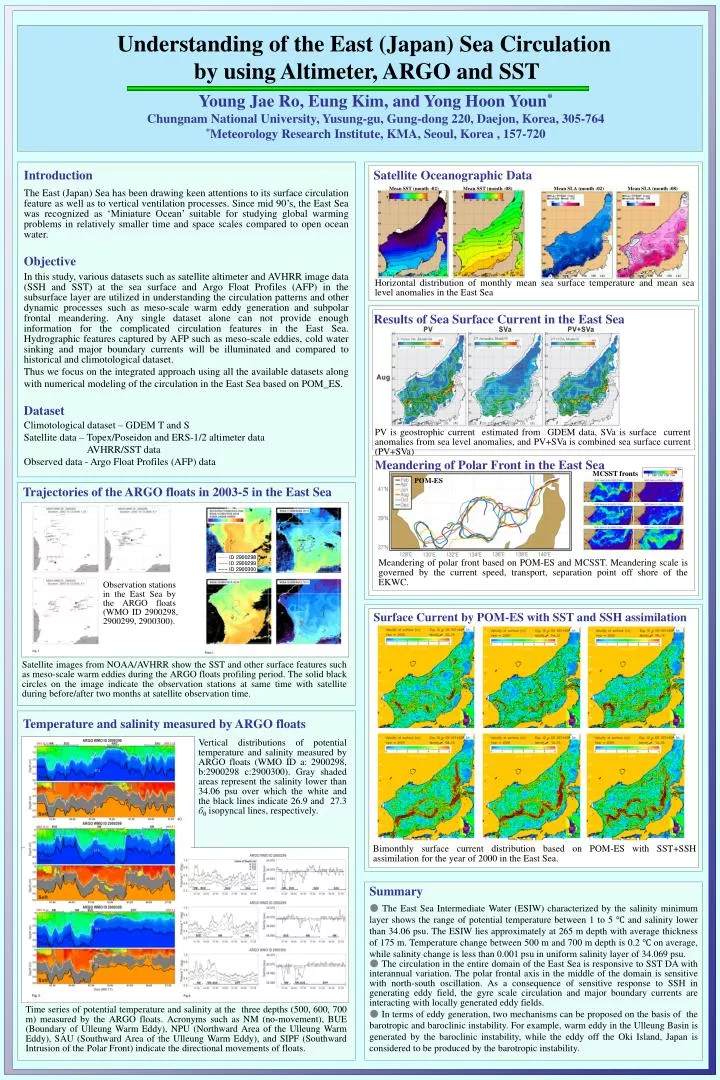
Understanding of the East (Japan) Sea Circulation by using Altimeter, ARGO and SST Young Jae Ro, Eung Kim, and Yong Hoon Youn* Chungnam National University, Yusung-gu, Gung-dong 220, Daejon, Korea, 305-764 *Meteorology Research Institute, KMA, Seoul, Korea , 157-720 Introduction Satellite Oceanographic Data Mean SST (month :02) Mean SST (month :08) Mean SLA (month :02) Mean SLA (month :08) The East (Japan) Sea has been drawing keen attentions to its surface circulation feature as well as to vertical ventilation processes. Since mid 90’s, the East Sea was recognized as ‘Miniature Ocean’ suitable for studying global warming problems in relatively smaller time and space scales compared to open ocean water. Objective In this study, various datasets such as satellite altimeter and AVHRR image data (SSH and SST) at the sea surface and Argo Float Profiles (AFP) in the subsurface layer are utilized in understanding the circulation patterns and other dynamic processes such as meso-scale warm eddy generation and subpolar frontal meandering. Any single dataset alone can not provide enough information for the complicated circulation features in the East Sea. Hydrographic features captured by AFP such as meso-scale eddies, cold water sinking and major boundary currents will be illuminated and compared to historical and climotological dataset. Thus we focus on the integrated approach using all the available datasets along with numerical modeling of the circulation in the East Sea based on POM_ES. Horizontal distribution of monthly mean sea surface temperature and mean sea level anomalies in the East Sea Results of Sea Surface Current in the East Sea Dataset Climotological dataset – GDEM T and S Satellite data – Topex/Poseidon and ERS-1/2 altimeter data AVHRR/SST data Observed data - Argo Float Profiles (AFP) data PV is geostrophic current estimated from GDEM data, SVa is surface current anomalies from sea level anomalies, and PV+SVa is combined sea surface current (PV+SVa) Meandering of Polar Front in the East Sea MCSST fronts POM-ES Trajectories of the ARGO floats in 2003-5 in the East Sea --- ID 2900298 --- ID 2900299 --- ID 2900300 Meandering of polar front based on POM-ES and MCSST. Meandering scale is governed by the current speed, transport, separation point off shore of the EKWC. Observation stations in the East Sea by the ARGO floats (WMO ID 2900298, 2900299, 2900300). Surface Current by POM-ES with SST and SSH assimilation Satellite images from NOAA/AVHRR show the SST and other surface features such as meso-scale warm eddies during the ARGO floats profiling period. The solid black circles on the image indicate the observation stations at same time with satellite during before/after two months at satellite observation time. Temperature and salinity measured by ARGO floats Vertical distributions of potential temperature and salinity measured by ARGO floats (WMO ID a: 2900298, b:2900298 c:2900300). Gray shaded areas represent the salinity lower than 34.06 psu over which the white and the black lines indicate 26.9 and 27.3 бθ isopyncal lines, respectively. Bimonthly surface current distribution based on POM-ES with SST+SSH assimilation for the year of 2000 in the East Sea. Summary ● The East Sea Intermediate Water (ESIW) characterized by the salinity minimum layer shows the range of potential temperature between 1 to 5 ℃ and salinity lower than 34.06 psu. The ESIW lies approximately at 265 m depth with average thickness of 175 m. Temperature change between 500 m and 700 m depth is 0.2 ℃ on average, while salinity change is less than 0.001 psu in uniform salinity layer of 34.069 psu. ● The circulation in the entire domain of the East Sea is responsive to SST DA with interannual variation. The polar frontal axis in the middle of the domain is sensitive with north-south oscillation. As a consequence of sensitive response to SSH in generating eddy field, the gyre scale circulation and major boundary currents are interacting with locally generated eddy fields. ● In terms of eddy generation, two mechanisms can be proposed on the basis of the barotropic and baroclinic instability. For example, warm eddy in the Ulleung Basin is generated by the baroclinic instability, while the eddy off the Oki Island, Japan is considered to be produced by the barotropic instability. Time series of potential temperature and salinity at the three depths (500, 600, 700 m) measured by the ARGO floats. Acronyms such as NM (no-movement), BUE (Boundary of Ulleung Warm Eddy), NPU (Northward Area of the Ulleung Warm Eddy), SAU (Southward Area of the Ulleung Warm Eddy), and SIPF (Southward Intrusion of the Polar Front) indicate the directional movements of floats.