Download
1 / 12
120 likes | 147 Views
Dot Plots. In a Dot Plot, a set of data is represented by using dots over a number line The number of dots over the number tell how many of the data point. Histogram. A histogram is like a Dot Plot but used when data includes a large number of values

E N D
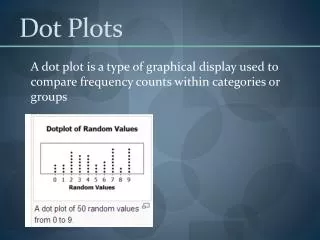
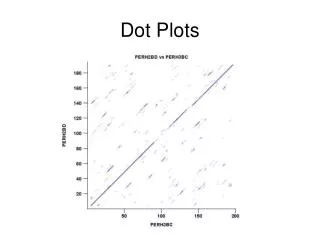
Dot Plots • In a Dot Plot, a set of data is represented by using dots over a number line • The number of dots over the number tell how many of the data point
Histogram • A histogram is like a Dot Plot but used when data includes a large number of values • It is the representation of a frequency by using rectangles
Creating a Dot Plot • Let’s create a Dot Plot with the following data: A group of 16 students measure their height in inches. These are their measurements. 97 inches 98 inches 98 inches 98 inches 94 inches 96 inches 98 inches 100 inches 99 inches 95 inches 101 inches 98 inches 99 inches 93 inches 97 inches 98 inches
Creating a Dot Plot • 1. Find the lowest and highest number! This means that we need to create a number line between 93 and 101. 97 inches 98 inches 98 inches 98 inches 94 inches 96 inches 98 inches 99 inches 95 inches 101 inches 98 inches 100 inches 99 inches 93 inches 97 inches 98 inches
Creating a Dot Plot • 2. Drawing a Number Line • Make sure you label this Number Line between 93 and 101. 93 94 95 96 97 98 99 100 101
Creating a Dot Plot • 3. Plotting the dots 98 inches 98 inches 97 inches 97 inches 100 inches 96 inches 98 inches 99 inches 93 inches 95 inches 98 inches 94 inches 98 inches 98 inches 101 inches 99 inches 93 94 95 96 97 98 99 100 101
Creating a Histogram • Let’s create a Histogram with the following data: The lengths of your hair measures from you scalp to the tip of the hair. Here are the hair lengths of students in one Gym Class. • 16 12 13 3 18 19 9 5 • 6 15 24 16 • 14 20 18 20
Creating a Histogram • 1. Creating a Bin The range for our data is between 3 and 24. If you use a bin width of 3, you will have 8 bins. 2 1 1 3 3 5 0 1 16 12 13 3 9 18 19 5 6 15 24 16 14 20 18 20
Creating a Histogram • 2. Drawing the Histogram 2 1 1 3 3 5 0 1 5 4 3 2 1 3-5 6-8 9-11 12-14 15-17 18-20 21-23 24-26
Creating a Histogram • 3. Reading the Histogram 5 4 3 2 1 3-5 6-8 9-11 12-14 15-17 18-20 21-23 24-26 The average hair length is between 12 and 20 inches.
Histogram vs. Dot Plot Histogram Dot Plot Used for data with less than 20 data points. Has dots showing each data point. • Used for data with more than 20 data points. • Combines alike data points in a column.