Download
1 / 16
160 likes | 307 Views
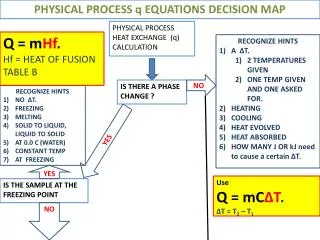
CALCULATION OF HEAT UNITS. By Linda De Wet. INTRODUCTION-HEAT UNITS.

E N D
CALCULATION OF HEAT UNITS By Linda De Wet
INTRODUCTION-HEAT UNITS • There is a wide selection of hybrids and varieties for most crops. Most of the warm-season crops have a wide range of maturities. Growing Degree Days (GDD), Degree Days (DD), Crop Heat Units (CHU) or Thermal time (TT) provide an indexing system to assist farmers to select the most suitable hybrids and varieties for their area. This indexing system was originally developed for field corn and has been in used in Ontario for 30 years. The crop heat unit ratings are based on the total accumulated GDD for the frost-free growing season in each area (Brown and Bootsma, 1997).
INTRODUCTION • Management • Prediction of stage of crop development • Timing of pesticide application • Scheduling of orderly harvest • Synchronising the flowering of cross-pollination crops • Hybrid seed production • Thermal time is the principal approach used to estimate the duration of crop growth and not temperature.
INTRODUCTION • Growth • Division + expansion of cells • Dry matter accumulation • Development • Orderly process – birth to death • Differs between organisms • Development stages and processes - different Ta • E.g. - time for egg stage of the Fruit fly, Dacus cucurbitae • Constant at a temperature of 10 oC - 35 oC • Short 20 oC - 30 oC • Longer at extremes - T > 37 oC and < 15 oC
If we calculate rate of development as 1/time, typical curves can be drawn with Z development rate versus Ta. These same curves hold for many biological processes. Figure 1 Typical curve for biological processes showing Ta vs Z development rate
Table 1 • A time period (day or hour) is chosen • Ta is logged • Rate at that Ta for change in time (Δt) is calculated • (1/t) is calculated • The rate x t = development that takes place • The total time to completion is time till sum at one • So, the assumption that is generally made, is that the calendar is correct basis for development, but development actually depends on Ta, and not date, as illustrated above
THERMAL TIME • When using TT some assumptions need to be made: • Development rate is constant • Straight line between Ta and development rate • Ta is always between base (Tb) and maximum temperature (Tmx) • Base temperature Tb is Ta where growth stops • Tmx is Ta at maximum growth rate • TT is the sum of (ΔT from Tb) x Δt (length time at current Ta)
THERMAL TIME • So the equation for thermal time is TT or DD = (Tave-Tb) Δt • The conditions for above is that (Tave-Tb) > 0 where • Tave = Tmx+Tmn/2 • If Tave = Tb, then TT = 0
THERMAL TIME • Time step is chosen so that Ta in that time is constant • Unit for TT is degree day (oCd) or degree hour (oCh) • So thermal time is the calculation of the time for development at a maximum rate in degree days • Total thermal time value can be used to calculate time taken at another Ta also • Thermal time can be calculated from weather data, i.e. Tmx and Tmn for each day, to get Tave. • TT = [(Tave) - Tb)] Δt
THERMAL TIME • If Tave < Tb then add only 0 (not negative nos) • Time period Δt is one day and is in degree-days above Tb • TT depends on specific organism, age and development stage but Tb is constant for a species (Table 2)
THERMAL TIME • Thermal time is used to predict harvest dates and emergence from planting date with the current year’s weather data. Usually the daily values are used • Calculation of TT on an hourly basis is more accurate • Environmental factors can also be included with TT • For plant disease - moisture on leaves is NB • Here the current vapour pressure (ea) or dew point temperature (Td) or RH is used, when the leaf is wet
Table 3 Example for DAILY DD calculated in the summer. Use Tb for Maize
PRACTICAL HEAT UNITS FOR CROP-ECOTOPE MATCHING Degree Days to Predict Harvest Dates • Use the weather data provided (Blackboard) to calculate the thermal time for a ………..crop. Use the base temperatures provided in the table and predict the germination, emergence and harvest dates (harvest being after ………… degree days have accumulated). Tabulate results. • The planting can only occur after …………….. and after 25 mm rain has been received. • Use the Heat Units map to decide which areas in S.A. your crop would be best suited to. • Check Assessment form for details concerning handing in requriements. __________________________________________________