Download
1 / 45
450 likes | 581 Views
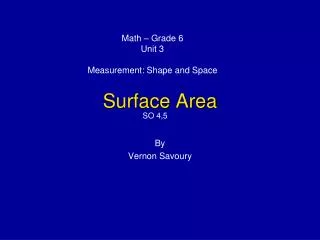
Surface Area and Cell Size Procedure 1 Investigation 2. Big Idea 2.A.3.b.1. These are cells and tissues with specialized functions. Think about their similarities in shape, size, nutrient procurement. Discuss.

E N D
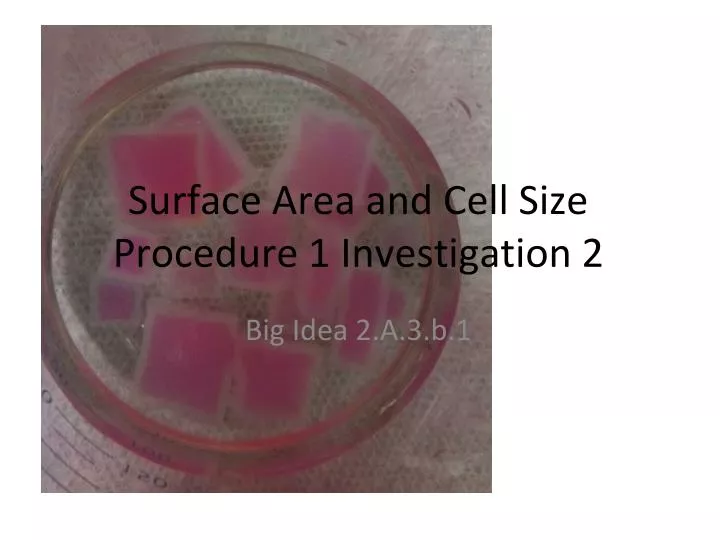
Surface Area and Cell SizeProcedure 1 Investigation 2 Big Idea 2.A.3.b.1
These are cells and tissues with specialized functions. Think about their similarities in shape, size, nutrient procurement. Discuss. http://www.technion.ac.il/~mdcourse/274203/slides/Digestive%20tract/17-Intestinal%20villi%20Jejunum-A.jpg http://www.cytochemistry.net/cell-biology/actin.6.gif http://iweb.tntech.edu/mcaprio/roots.htm
Modeling Surface Area and Cell Size • Wear your safety eyewear • Wear your apron or lab coat • Wear your closed toe shoe • The agar cubes are soaked in a 0.01% NaOH solution. • The agar cubes have been prepared with 1% phenolphthalein, which is a pH indicator.
Acid or Base? • Phenolphthalein Color Indicator
You have been given, or will cut, 3 agar blocks. • These are models for your cells. • Measure the surface area of each “cell.” • Calculate the volume. • When the blocks are placed into a solution, which block will the solution diffuse all the way through fastest? Explain your prediction in your journal. • Plan, get approval, & perform an experiment to test your prediction. Have a prepared table and a plan for calculations you will perform.
Check your work (formative) • Did you record all your data appropriately? • Did you measure using a metric ruler? Did you rinse the ruler off after use? • Did you calculate rate of diffusion for each cube in cm/min? • Did you graph this as a function of SA/Vol? • Did you calculate the extent diffusion as a percent of the total volume? • Did you graph the extent diffusion against surface area/volume?
Extent Diffusion as a percent of total • Calculate the clear volume of the cube. • Calculate the total volume of the cube. • Subtract to get the pink volume. • Divide the pink volume by the total volume.
Percent Diffused Surface Area/Volume
Procedure 2: Modeling Diffusion and Osmosis • With your assigned partner work through Procedure 2: Modeling Diffusion and Osmosis through page S57. • During your 30 minute wait time look at osmosis in the red onion. (Continue ppt) • Do not discard your solutions. We still need them. • As you get your data (Step 4: Percent change in weight), record with the class.
Onion Osmosis Using Image J
Before Starting… • You need to have • A microscope • A red onion • Something to cut with (scalpel or razor) • A slide and cover slip • Some 15% salt solution and a pipette • A piece of paper towel • A clear metric ruler • Image J installed (free at NIH.gov) • You need to know • The diameter of the field of view of your microscope. • Directions follow.
How to: Microscopic Measurement Determine the diameter of your “field of view.” 1. Begin with a clear ruler. 2. Place on the stage, visible under the lowest magnification for your microscope. 3. Determine the diameter of the field of view in mm. 4. 1mm=1000 Micrometers (μm) 1 mm
How to: FOV under a higher power lens For a higher power, you need to calculate the field of view.
Zoom in • (Original Obj/New Obj) x Original FOV=New FOV • FOV=Field of View 15
Determining Percent Change in Area Find your file and open it.
To get area and perimeter... Select the straight line tool. Drag across your field of view.
Trace with the freehand toolGo to analyze: Measure Compare before and after
Calculate • Percent change in area • Percent change in perimeter.
Assessment • Excerpt from “The Rime of the Ancient Mariner” by Samuel Taylor Coleridge. This is a poem about a sailor. • Water, water everywhere, • And all the boards did shrink; • Water, water, everywhere , • Nor any drop to drink. • Why did the boards of the ship shrink? • Why couldn’t the mariner drink any of the water? From BSCS Biology 9th ed
Brainstorm with your partner and another pair. • See page S58. • Come up with questions to investigate. • Share with the class.
Design an experiment to determine the relative molarity of several solutions. You must use the principles of osmosis and diffusion and a plant tissue. See Page S59.
Question If we soak potato CELLS in sucrose which way will water move? Water always moves from a higher water potential to a lower water potential.
Ψ = Ψp + Ψs Pressure Potential Water Potential Solute Potential Water always moves to a lower, more negative, water potential.
Ψs= Solute Potential Ψs Solutes are always negative More solutes = more negative Which way will water move? What is happening to the pressure potential in cell?
Ψp= Pressure Potential Usually Positive
Water Potential in the Potato Cells • Revise your definition: Osmosis is the movement of water molecules through a selectively permeable membrane from a region of higher water potential to an area of lower water potential • Water always moves to a more negative water potential.
Water Potential • Ψ= Ψp + Ψs • Where there is no % change in mass, the solution in the beaker has the same water potential as the potato cells. Dynamic Equilibrium
Water Potentialat Equilibrium Ψ of Solution in Beaker = Ψ of Potato = (Ψ= Ψp + Ψs) = (Ψ= Ψp + Ψs) Potato cells
Water Potential Solution Potato Cells (Ψ= Ψp + Ψs) = (Ψ= Ψp + Ψs) Ψp= 0 (open beaker) Ψ=Ψs + 0 = Ψ= Ψp + Ψs Ψ=Ψs = Ψ= Ψp + Ψs Ψs = Ψ= Ψp + Ψs Pure water at atmospheric pressure has a water potential of zero.
Collect Temperature of liquid! Potato Core Results- What elements are needed in a good graph? Discuss trends, errors. Your lab group should be prepared to use the terms hypertonic, hypotonic, isotonic as they report to the class.
To CalculateΨs Ψs = -iCRT i= Ionization constant (sucrose is 1.0 because it does not ionize). C= Molar Concentration (from line of best fit where the line crosses the x axis) R= Pressure Constant (0.0831 liter bars/mole °K T= Temperature °K (273 + °C)
An example • Ψs = -iCRT • Ψs= -(1.0)(0.36 mole/liter)(0.0831 liter bar/mole °K)(295 °K) • -8.83 bars • This equals the entire Ψof the cell.