Download
1 / 17
170 likes | 177 Views
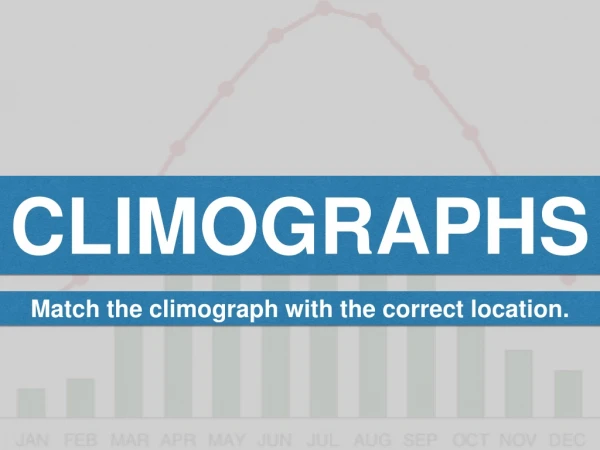
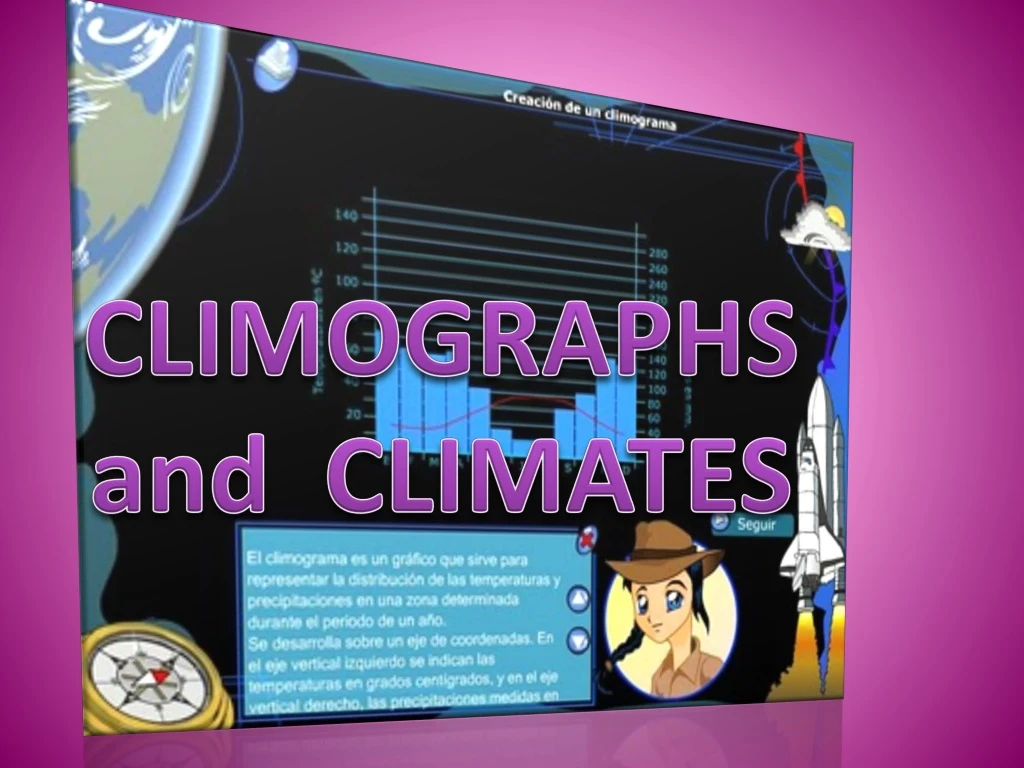
CLIMOGRAPHS and CLIMATES. WHY CLIMOGRAPHS?. MAIN REASON. THEY HELP US TO UNDERSTAND CLIMATES QUICKER AND BETTER BY ANALSYING ITS TEMPERATURE AND PRECIPITACION. AND MOST IMPORTANTLY, THEY CAN BE USED TO INFER CONNECTIONS BETWEEN CLIMATE AND HUMAN CONDITIONS. SEVERAL REASONS.

E N D
CLIMOGRAPHS and CLIMATES
WHY CLIMOGRAPHS? MAIN REASON THEY HELP US TO UNDERSTAND CLIMATES QUICKER AND BETTER BY ANALSYING ITS TEMPERATURE AND PRECIPITACION AND MOST IMPORTANTLY, THEY CAN BE USED TO INFER CONNECTIONS BETWEEN CLIMATE AND HUMAN CONDITIONS SEVERAL REASONS OTHER REASONS • THEY ARE VISUAL • THEY ARE SIMPLE BUT ACCURATE • THEY HELP TO DEVELOPE HIGHER ORDER THINKING SKILLS • IT IS FUN
CLIMOGRAPH DEFINITION WHAT ARE OUR LEARNING OBJECTIVES? A CLIMOGRAPH IS A GRAPHICAL RE PRESENTATION OF BASIC CLIMATIC PARAMETERS, THAT IS MONTHLY AVERAGE TEMPERATUREAND PRECIPITATION AT A CERTAIN LOCATION. IT IS USED FOR A QUICK-VIEW OF THE CLIMATE OF A LOCATION. LEARN HOW TO CONSTRUCT A CLIMOGRAPH STUDENTS WILL… LINK THEM TO THE MAIN LANDSCAPES LEARN HOW TO READ AND ANALYSE CLIMOGRAPHS TRY TO DISCERN HOW THE CLIMATE IMPACT THE HUMAN CONDITIONS UNDERSTAND THE MAIN CLIMATES OF THE WORLD
PENCIL, RULER, ERASER GRAPH PAPER BLACK FELT-TIP PEN MATERIALS COLOUR PENCILS, RED AND BLUE AND…
SEVERAL HANDOUTS: CONSTRUCTION AND ANALYSIS OF CLIMOGRAPHS DATA FOR MAKING CLIMOGRAPHS CLIMATES OUTLINE CLIMOGRAPHS EXAMPLES
OPENING QUESTION WHAT CAN TEMPERATURE AND PRECIPITATION INFORMATION TELL US ABOUT THE WAY PEOPLE LIVE IN DIFFERENT LOCATIONS…? 4 MINUTES TO DISCUSS IN GROPUS
SOME POSSIBLE ANSWERS…. • POPULATION DISTRIBUTION: • FERTILE AREAS AR MORE POPULATED • DESERT AREAS ARE UNINHABITED • HUMID AREAS ARE UNINHABITED • POLAR REGIONS ARE UNINHABITED • ECONOMIC DEVELOPMENT: • FERTILE AREAS ARE USALLY MORE DEVELOPED • DRY, COLD AND HUMID AREAS ARE USUALLY POORER
STEPS TO FOLLOW E F M A M J JL A S O N D 1. On a piece of graphpaper, draw a horizontal axis, centeredonthesheet. Itrepresentsthemonths of theyear.
STEPS TO FOLLOW LEFT Temperaturesare represented. Ifthere are negativevalueswemustextendthe line down RIGHT Precipitationisrepresented. Thevalues in this case are goingtobedoublethetemperature Becausethisistheonlywaytoseethedrymonths (thosewhoserainfallisappearbelowthe line of thetemperature). Wewillseeit in a moment…. Why? P mm T ºC 140 MAKE SURE YOUR PRECIPITATIONS ARE DOUBLE YOUR TEMPERATURES 120 100 40 80 30 60 20 40 10 20 0 0 E F M A M J JL A S O N D -10 P= 2T -20 2. Drawtwo vertical lines. Thevalues are markedalongthe line in regular increments. Dependingontheamount of precipitationyou decide theintervals (5 or 10 oreven 20…).
Weaddthe data P mm T ºC 140 120 100 40 80 30 60 20 40 10 20 0 0 E F M A M J JL A S O N D -10 P= 2T -20 Weaddthetemplate of data relatedtothatspecificclimograph. Itisveryimportant so wealways can checkthecorrect data.
Werepresenttemperatures… P mm T ºC 140 120 100 40 80 . . . . . . . 30 . . . 60 . . 20 40 10 20 0 0 E F M A M J JL A S O N D -10 P= 2T -20 3. Subsequently, temperatures are representedbypointswewillmake in themiddle of thespaceforeachmonth. Thesepoints are eventuallyconnectedby a red line.
Werepresentprecipitations… 220 P mm T ºC 200 180 160 140 120 100 40 80 . . . . . . . 30 . . . 60 . . 20 40 10 20 0 0 E F M A M J JL A S O N D -10 P= 2T -20 4. Rainfallisrepresentedby bar graphspaintedblue. Thereferenceistheone of precipitations (rightside).
VOCABULARY TO COMMENT… 1. VERBS RISE, INCREASE, GROW, GO UP TO, CLIMB, BOOM, PEAK, FALL, DECLINE, DECREASE, DROP, GO DOWN, REDUCE REMAIN STABLE, REMAIN STEADY, STAY CONSTANT, NO CHANGE, MANTAIN THE SAME LEVEL, CRASH, COLLAPSE 2. ADJECTIVES SHARP, RAPID, HUGE, DRAMATIC, SUBSTANTIAL, CONSIDERABLE, SIGNIFICANT, SLIGHT, SMALL, MINIMAL, MASSIVE 3. ADVERBS GENTLY, GRADUALLY , SHARPLY, RAPIDLY, DRAMATICALLY , SUBSTANTIALLY, CONSIDERABLY, SIGNIFICANTLY, SLIGHTLY, MODERATELLY
COMMENTARY… PRECIPITATION, ANALYSIS 1. PRECIPITATION, TOTALS 2. DISTRIBUTION OF PRECIPITATION
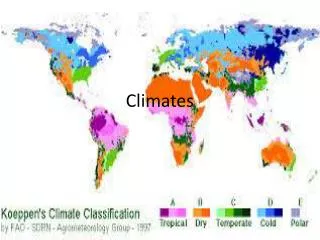
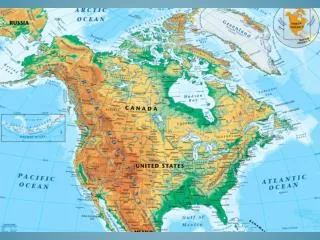
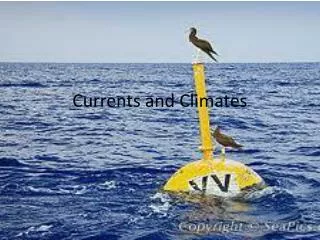
CLIMATE ZONES • TEMPERATE CLIMATES • Thetemperatezones are betweenthe tropical zone and the polar zone in bothhemispheres. • Temperatezoneshavefourseasons: the more extreme winterand summerseasons, and themilderspring and autumnseasons. • We can identifythreedifferenttypes of climate in thetemperatezones: • Oceanic • Mediterranean • Continental • COLD CLIMATES • Thecoldzonesincludetheareaaroundthepoles, and alsoareasaboveanaltitude of 2500 metres. There are twotypes: • Polar • Mountain • HOT CLIMATES • Theseclimates are foundbetweentheTropic of Cancer and theTropic of Capricorn, wheretheSun´sraysreachtheEarth´ssurface at a directangle. Averagetemperatures are high (over 18ºC), and thereis no winter. There are threetypes of hotclimates: • Equatorial • Tropical • Desert (hotdessert and steppe)