Download
1 / 6
60 likes | 270 Views
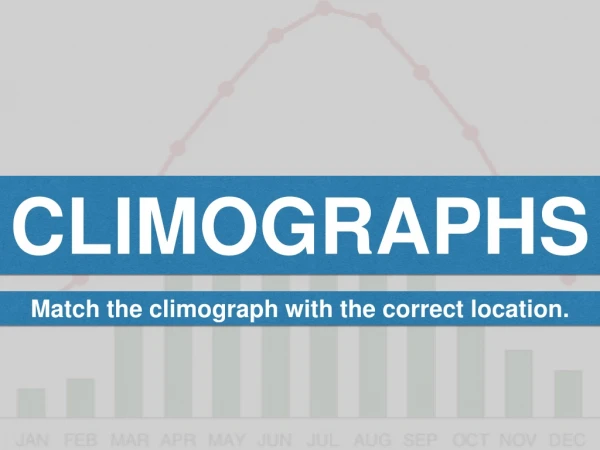
Climographs. Climograph. Visual representation of an areas climate The climograph combines temperature and precipitation data Climographs give you a good idea of an areas climate Look at climographs of countries all over the world. Precipitation . Illustrated with the bar graph .

E N D
Climograph • Visual representation of an areas climate • The climograph combines temperature and precipitation data • Climographs give you a good idea of an areas climate • Look at climographs of countries all over the world
Precipitation • Illustrated with the bar graph
Temperature Data • Illustrated with the line graph
Make your own climograph…… • Teacher will assign data sets to students • Use the back of your climograph worksheet to create your own climograph