Download
1 / 26
270 likes | 329 Views
ASSESSING AND MAPPING WATER SCARCITY LEVEL IN JORDAN USING WATER POVERTY INDEX. Jordan. Ayat A. Hazaymeh. Royal Scientific Society For Jordan Since 1970. Water Scarcity ǃǃ ǃ. Water scarcity is the lack of fresh water resources to meet water demand, and it can result from two mechanisms:.

E N D
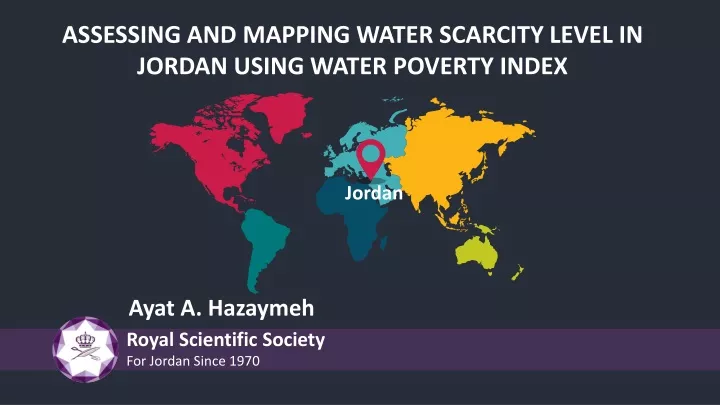
ASSESSING AND MAPPING WATER SCARCITY LEVEL IN JORDAN USING WATER POVERTY INDEX Jordan Ayat A. Hazaymeh Royal Scientific Society For Jordan Since 1970
Water Scarcity ǃǃǃ • Water scarcity is the lack of fresh water resources to meet water demand, and it can result from two mechanisms: • ECONOMIC WATER SCARCITY • Results from poor management of the sufficient available water resources • PHYSICAL (ABSOLUTE) WATER SCARCITY • results from insufficient available water resources • to supply a demand • (JORDAN)
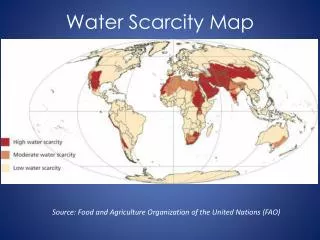
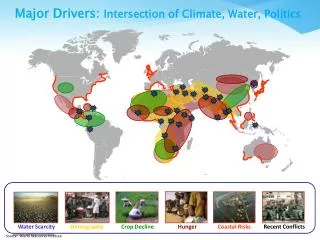
Global Water Scarcity Jordan Source: United Nations World Water Development Report 4. Volume 1: Managing Water under Uncertainty and Risk
Key Water Scarcity Indicators 04 01 Interannual Variability of Water Supply Water Security Risk Index 01 02 02 05 Total Renewable Internal Freshwater Resources Baseline Water Stress 03 06 03 06 05 04 Internal Renewable Freshwater Resources Per Capita 2040 Future Water Stress WATER POVERTY INDEX
Global Water Scarcity Measures: Jordan Ranking Water Security Risk Index Source: Maplecroft, 2011 33 27 Total Renewable Internal Freshwater Resources Source: The World Bank, 2014 2040 Future Water Stress Source: World Resources Institute, 2015 19 Interannual Variability of Water Supply Source: World Resources Institute, 2013 14 Extremely High Stress Baseline Water Stress Source: World Resources Institute, 2013 7 Internal Renewable Freshwater Resources Per Capita Source: Food and Agriculture Organization (FAO) , 2014 Extremely High Stress 3
Water Facts: Jordan 4 1 • Jordan ranks as the second water-poorest country in the world • The shared water is around 40% of total water resources 2 5 • The available annual renewable water resources per person is Less than 100m3 (global line for absolute water scarcity of 500m3) Sources of water are: 27% surface water, 14% treated wastewater and 59% groundwater. 6 3 In 2017, Quantity of available renewable water resources was around 853 MCM whereas the estimated water demand for all sectors was 1412 MCM 52% of available water in used in Agriculture, 46% of which is groundwater sources. Source: Ministry of water and Irrigation
POPULATION 5,597,000 6,698,000 6,993,000 7,427,000 8,114,000 8,804,000 9,559,000 9,798,000 10,053,000 2004 2010 2011 2012 2013 2014 2015 2016 2017
POPULATION THE KINGDOM’S 2008 WATER STRATEGY ASSUMED CONSISTENT POPULATION GROWTH, FROM ABOUT 5.87 MILLION IN 2008 TO OVER 7.8 MILLION BY 2022. BUT WITH THE INFLUX OF SYRIANS, THE POPULATION OF JORDAN IN 2013 ALREADY APPROACHED 8 MILLION
Objective of This Study O B This study aims to evaluate the changes of water poverty and scarcity level in Jordan during (2010-2017) using the Water poverty Index (WPI) to better understanding the challenges that facing water sector in Jordan C J T E I V E
Water Poverty Index (WPI) A multi-dimensional approach which examines all thevarious components which affect water availabilityincluding: environmental conditions, social factors,capacity of users to pay and lobby for water services andthe various uses of water by communities” (Agrawal and Agrawal, 2011; Mlote, Sullivan and Meigh, 2002).
Water Poverty Index (WPI) Five Components [Resources] + [Access]+ [Use] + [Capacity] + [Environment] Environment Resources Capacity Access Use
Key Components of the WPI RESOURCES: The physical availability of fresh water resources ACCESS: The extent of access to water and sanitation services USE :The ways in which water is used for different purposes; it includes domestic, agricultural and industrial use. RESOURCES CAPACITY: The effectiveness of people’s ability to manage water resources ACCESS USE ENVIRONMENT: An evaluation of the environmental impact of water management CAPACITY ENVIRONMENT
Water Poverty Index: Components Resources • Average water supply • Average annual rainfall Source of data • Ministry of water & Irrigation report, (2010-2017) Access • % population with access to pipe water network • % population with access to sanitation • Source of data • Ministry of water & Irrigation report, (2010-2017) • Department of Statistics database Use • Domestic water use (L/Capita/Day) • Source of data • Ministry of water & Irrigation report, (2010-2017)
Water Poverty Index: Components • Capacity • Economic capacity: Average annual income • Institutional capacity: Total cost of water and sewage projects • Physical capacity: Under-five mortality rate, Average annual percent of typhoid and Paratyphoid cases (neglected as there is no significant difference) • Social capacity: Enrolment rate, unemployment rate • Source of data • Department of Statistics database • Ministry of Water and irrigation, (2010-2017) • Ministry of health, (2010-2017) • Department of Statistics database • Ministry of Education • Source of data • Ministry of health, (2010-2017) • Ministry of Water and irrigation, (2010-2017) • Environment • Results of Microbial Analysis of Conforming Drinking Water Samples
Water Poverty Index: Conceptual Framework • Each of sub-indicators are normalized using the following equation to get value 0 to 1 1 • (xi – x min) / (x max– x min) • Within each of the five components, sub-indicators are averaged and then multiplied by 20 to get the component score and then added together to get the final index score for the WPI 2 • The scores of the index range on a scale of 0 to 100; the highest value is taken to be the best situation that is, the lowest possible level of water poverty while 0 is the worst. 3 WPI 0 • Worst 100 • Best
2010 2011 2012 76.01% 59.36% 64.87%
2014 2015 2013 73.14% 62.73% 68.21%
2016 2017 65.80% 70.50%
2014 2011 2012 2010 2017 • 68.21% • 65.80% • 76.01% • 64.87% • 59.36% Status before the Syrian Crises The lowest year of WPI as a result of Syrian Crises WPI increased due to Disi water Project The Beginning of Syrian Crises WPI back decreased • July 2013 Start date of pumping water from Disi Water Conveyance, 100 MCM annually Expected to cover Jordan’s needs until 2022 2022 2016 This estimate has been revised down to 2016
Conclusion Access Resources Environment In terms of Access the scored is relatively high and there is no significant changes among the years due to reach a high percentage of access Jordan is suffering from lack of available natural water resources, therefore the efforts are mainly focused to find additional water resources through MEGA Projects such as Disi water, Red Dead Sea and Desalination of sea water In terms of capacity the scored is relatively increased among the years due to increasing the fund for water and sanitation projects and increasing the social capacity to face water scarcity. In terms of Environment the scored is also high and there is no significant changes among the years due to due to high restriction of the Jordanian water standards and regulations.
Conclusion • Considerable population growth as influx of Syrian refugees have aggravated water scarcity problem in Jordan. 01 02 • WPI is a suitable index for evaluating the changes of water security level in Jordan. 03 • WPI can be used to monitor the progress of water sector and determine priorities for water needs • Disi water Project contribute significantly in reducing the water scarcity level by filling the gaps between the demand and supply (44% of the gap as MWI publication). 04
THANK YOU FOR LISTENING D N E THE