Download
1 / 21
240 likes | 395 Views
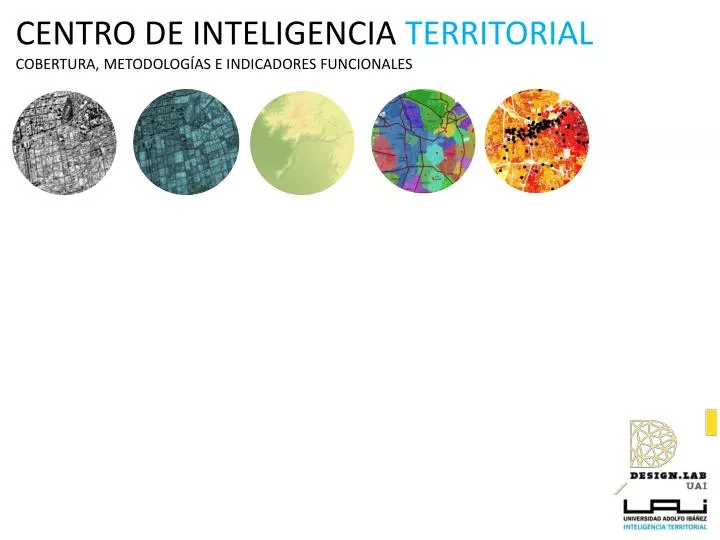
CENTRO DE INTELIGENCIA TERRITORIAL COBERTURA, METODOLOGÍAS E INDICADORES FUNCIONALES. 22 CIUDADES DE CHILE A NIVEL DE MANZANA (SOBRE 100.000 HAB.) 70% DE LA POBLACIÓN NACIONAL INFORMACIÓN A NIVEL DE MANZANA. COBERTURA TERRITOTIAL. ORGANIZACIÓN INFORMACIÓN TERRITORIAL.

E N D
CENTRO DE INTELIGENCIA TERRITORIALCOBERTURA, METODOLOGÍAS E INDICADORES FUNCIONALES
22 CIUDADES DE CHILE A NIVEL DE MANZANA (SOBRE 100.000 HAB.) • 70% DE LA POBLACIÓN NACIONAL • INFORMACIÓN A NIVEL DE MANZANA COBERTURA TERRITOTIAL
ORGANIZACIÓN INFORMACIÓN TERRITORIAL ESTRUCTURA DE DATOS CIT Arquitectura de datos CIT
SEGRAGACIÓN RESIDENCIAL – FONDAP COES • INDICADORES FUNCIONALES URBANOS – FONDAP COES • ANÁLISIS DE REDES – FONDAP COES ; PEÑALOLÉN • INDICADORES DE SEGURIDAD – GENDARMERÍA – MINISTERIO DEL INTERIOR • ANÁLISIS MULTICRITERIO • SEGREGACIÓN ESCOLAR - FONDAP EDUCACIÓN (Ministerio de Educación) LÍNEAS DE INVESTIGACIÓN
Población Espacio público Relaciones SEGREGACIÓN RESIDENCIAL GSE
La generación de indicadores muchas veces recoge la espacialización como una forma de representación y no como un insumo espacial. INDICADORES FUNCIONALES - PROBLEMÁTICA 18,21 m2 por habitante 1,29 m2 por habitante Variación del indicador con Parque Metropolitano, consideraciones con respecto a la funcionalidad
ID: 13164780138 Atributos del usuario Origen INDICADORES FUNCIONALES - MÉTODO 5 minutos Pedestre Destino Atributos del equipamiento ID: 13154280045
av1: 9 manzanas pobladas la alcanzan en 15 minutos de caminata av2: 7 manzanaspobladas la alcanzan en 15 minutos de caminata m1: es servida por av1, por lo tanto su superficie de área verde asociada corresponde a: m8: es servida por av1 y av2, por lo tanto su superficie de área verde asociada corresponde a: INDICADORES FUNCIONALES - MÉTODO m1 m4 m5 av1 m2 m6 m7 m3 Av2 m11 m8 m10 m12 m9 Áreas Verdes Manzanas habitadas (2011) comparabilidad y capacidad de carga Manzanas no habitadas (2011)
Se obtienen los m2 efectivos por habitante • Se generaliza ponderando por población dependiendo de la unidad de análisis a ser representada INDICADORES FUNCIONALES - MÉTODO
INDICADORES FUNCIONALES - MÉTODO factor ponderador del área verde metropolitrana superficie total (m2)del área verde metropolitrana
Aporte de áreas verdes locales al Gran Santiago 2,03 m2/hab. Aporte de áreas metropolitanas 0,37m2/hab. Total de áreas verdes por habitante 2,41m2/hab. INDICADORES FUNCIONALES - MÉTODO
INDICADORES RESULTADOS IAV3 Patrones generales; Desigual GSE (+) ; aporte metropolitano (-)
INDICADORES RESULTADOS ICUL centralidades (población flotante); Valparaíso (comuna +)
INDICADORES RESULTADOS IDEP distribución menos concentrada; GSE (-); Santiago (-); Antofagasta y Valparaíso (+)