Download
1 / 19
190 likes | 393 Views
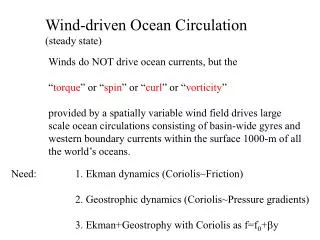
Comparison of Vertical Mixing Parameterizations for the Wind-Driven Coastal Ocean. Scott Durski Oregon State University. Thanks to: Dale Haidvogel, Scott Glenn, Hernan Arango and John Allen. Large, McWilliams and Doney, K-Profile parameterization. Boundary layer mixing. Interior mixing.

E N D
Comparison of Vertical Mixing Parameterizations for the Wind-Driven Coastal Ocean Scott Durski Oregon State University Thanks to: Dale Haidvogel, Scott Glenn, Hernan Arango and John Allen
Large, McWilliams and Doney, K-Profile parameterization Boundary layer mixing Interior mixing Mixing parameterized as a function of boundary layer depth, turbulent velocity scale and a dimensionless ‘shape’ function. Shear generated mixing Based on gradient Richardson Number Ko Boundary layer depth Based on bulk Richardson number. 0.5 Rig Internal wave mixing Constant ‘background’ mixing value from open ocean thermocline observations. Turbulent velocity scale From atmospheric surface boundary layer similarity theory Double diffusive mixing Based on laboratory measurements, based on density ratio. Shape function Third order polynomial with coefficients determined from boundary conditions at surface and ocean ‘interior’.
Mellor-Yamada Level 2.5 turbulence closure scheme Vertical mixing is estimated based on two prognostically calculated quantities, tubulent kinetic enery and a turbulent length scale. Background mixing coefficients TKE equation q2l equation Turbulent quantities are advected and diffused both vertically and horizontally. Shear production of TKE occurs at a flux Richardson Number below 0.19. Wall proximity function W enforces surface layer similarity theory at surface and bottom boundaries. (from Kantha and Clayson, 1994)
2No 0 m No z No/10 -7.5 m No/100 density 1-D wind driven boundary layer test case Circulation model: ROMS (with a single tracer equation to represent density – rather than separate T and S equations.) Setup: Double-periodic uniform domain to represent one-dimensionality. 25 meter water depth – discretized into 80 evenly spaced levels. Initialization: At rest. Well-mixed water column down to 7.5 meters depth Uniform N2 below this depth. Forcing: 0.03 N/m2 wind stress (spun-up over half a day) Test cases: Stratification below the mixed layer of 4 different intensities to represent the range observed in the coastal ocean.
Time-series of surface density for the four cases • KPP entrains more at lower stratification than M-Y. • M-Y entrains more at very high stratification. • Entrainment is more intermittent with KPP.
Features of the circulation No/10 case - KPP density Stratification intensifies at base of boundary layer. Inertial oscillations develop causing periods of enhanced and reduced shear at the pycnocline. Stratification intensifies and relaxes out-of-phase with shear (particularly strongly with KPP). u-velocity v-velocity N2 velocity shear
Vertical flux divergence KPP shows much stronger response to incidents of enhanced shear at base of b.l, while exhibiting less entrainment at other times. Flux is alternately positive and negative at pycnocline with KPP, but not so with M-Y. (No/10 case) KPP M-Y
Onset of turbulence at the pycnocline Turbulence retreats upwards with KPP during low shear periods. M-Y maintains mixing in more highly stratified waters at high Ri# during these periods as a result of diffusion and finite-rate of TKE dissipation. During high shear periods KPP penetrates more deeply into the stratification at a higher Richardson number. Konset = 5 x 10⁻⁶ KPP M-Y Konset Rig at Konset N2 at Konset Shading indicates periods of low shear at base of boundary layer.
Why does KPP entrain more in low stratification and M-Y entrain more in high stratification? Which scheme mixes more depends on whether sustained entrainment during low shear periods by M-Y predominates enhanced mixing during high shear periods with KPP. 2No No/10 Higher stratification at base of boundary layer does not lead to equally higher shear there. (Shear is primarily controlled by the surface stress in this case.) Consequently depth of penetration of shear-generated-mixing is greatly reduced at high N2. vertical profile of N2 maximum velocity shear2
Modifications to the K-profile Parameterization for coastal ocean application. The original KPP scheme must be appended with a bottom boundary layer approximation to avoid erroneously high estimates of mixing (particularly in shallow water and near the bottom). Profiles of turbulent mixing coefficient in different shallow water situations ? ? ? ? ? 1) Matching with log layer similarity theory where surface boundary layer extends to the bottom.. 3) Apply matching rules when surface and bottom boundary layers overlap. (BBL estimate over-writes SBL estimate where they overlap) 2) Add a K-profile parameterization for the bottom boundary layer modeled after SBL scheme. Note: Only a neutral bottom boundary layer is considered.
Interacting boundary layers, 1-D model setup. Setup: Double-periodic uniform domain. 15.5m, 16.0m, 18.0m and 20m water depth – discretized into 80 evenly spaced levels. Initialization: At rest. Well-mixed water column down to 7.5 meters depth Uniform N2 within a pycnocline of thickness 0.5m, 1m, 3m and 5m Forcing: 0.03 N/m2 wind stress and oppositely directed bottom stress (spun-up over half a day) Test cases: Vary both intensity of stratification in pycnocline and thickness of the initial pycnocline. 0.03 N/m2 h N2 -0.03 N/m2
Variation in entrainment with pycnocline thickness for high stratification case. Shear-generated mixing within the pycnocline between the boundary layers leads to enhancement of mixing with KPP for suitably thin interfaces. Time-series of surface density (No case) KPP M-Y
Evolution of the pycnocline with lower stratification A transition occurs between maintaining an intensified pycnocline when the initial thickness of the stratified layer is high, to the rapid development of a well-mixed water column when it is thin. (No/10 case) Time-series contour plots of density over the water column Thickness of pycnocline KPP MY 1 m 3 m 5 m
Divergent response with the two schemes for a 1.5m thick pycnocline The response with the two schemes is markedly different when the initial pycnocline thickness is 1.5 meters. Time-series contour plots of density over the water column KPP MY Time-series contour plots of v-velocity over the water column
Interacting boundary layers: 2-D coastal upwelling on a shallow shelf Setup: 250 meter resolution in the across-shore direction. Periodic in the alongshore direction. 40 evenly spaced vertical levels. 6 meter depth at coast, sloping downward offshore at a rate of 1 m/km Initialization: At rest. Well-mixed water column down to 7.5 meters depth Uniform N2 within a pycnocline of thickness 1m, 3m and 5m Forcing: 0.03 N/m2 wind stress (spun-up over half a day) Test cases: Vary: • intensity of stratification in pycnocline, • thickness of the initial pycnocline • bottom slope.
Upwelling with a highly stratified pycnocline For strongly stratified pycnoclines, advection dominates vertical mixing in the evolution of the two-dimensional upwelling. (No, 1m thick initial pycnocline) KPP M-Y
Upwelling at low stratification Vertical mixing ‘competes’ with advection at lower stratification KPP forms a stronger surface-upwelling-front earlier due to stronger mixing where surface and bottom boundary layers interact. Early offshore migration of upwelling front is dictated by vertical mixing, not Ekman transport with KPP. (No/20, 5 m thick initial pycnocline) Day 0.75 Day 1.75 Day 3.0 Day 4.5 KPP M-Y
Impact of choice of vertical mixing parameterization on a simple biological model. Consider a simple model of an organism that can obtain a ‘bloom’ state if a large enough ‘seed-population’ co-occurs with adequate food supply. Given initial presence of organisms only at or above the pycnocline and abundance of food below the pycnocline, what develops with the two vertical mixing schemes? A significant bloom of the organism develops in the near-shore region with KPP, while concentrations remain low everywhere with M-Y.
Conclusions KPP responds more strongly to shear mixing events in the interior. M-Y sustains mixing in intermittently high Rig# environments via diffusion of TKE and due to the finite rate of decay of turbulence in the model. The enhancement of mixing due to shear with KPP becomes less potent ad the stratification of the pycnocline increases. KPP generates more mixing in the interior of the pycnocline, where surface and bottom boundary layers interact. Very distinct differences in the resultant circulation arise for particular initial conditions which may cause the results obtained from the two schemes to diverge in more complicated (realistic) settings. Even when the differences in the physical fields produced with the two schemes are small, systems which respond non-linearly to these differences may exhibit dramatic differences.