Download
1 / 21
220 likes | 318 Views
Monitoring of high-altitude ecosystems. Don Campbell Alisa Mast Dave Clow. Leora Nanus George Ingersoll Carol Kendall. Jill Baron Alex Wolf. Heather Rueth Brenda Moraska Koren Nydick. Mark Williams Paul Brooks. Tamara Blett John Turk.

E N D
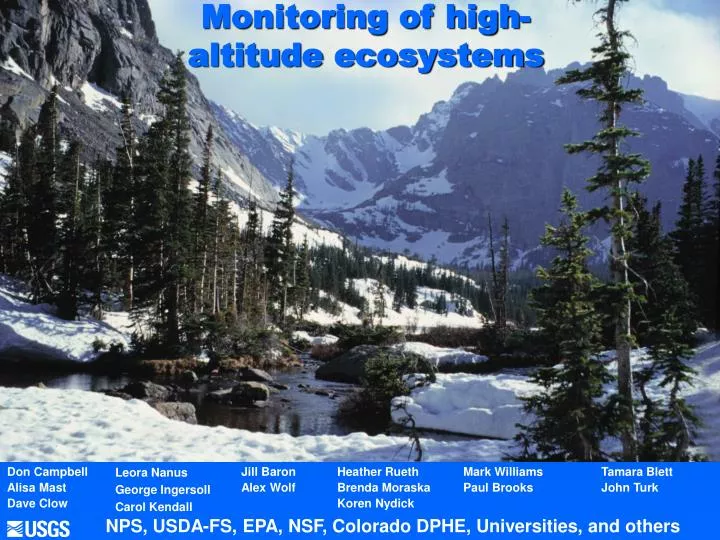
Monitoring of high-altitude ecosystems Don Campbell Alisa Mast Dave Clow Leora Nanus George Ingersoll Carol Kendall Jill Baron Alex Wolf Heather Rueth Brenda Moraska Koren Nydick Mark Williams Paul Brooks Tamara Blett John Turk NPS, USDA-FS, EPA, NSF, Colorado DPHE, Universities, and others
Why monitor ‘clean’ systems? • Mountains are primary water supply for western U.S. • Valuable as reference sites for disturbed areas. • Crown jewels of public lands: mandates to protect wilderness and parks “unimpaired”…
How do we tell what is “impaired”? Pollutants in atmospheric deposition: Acidity (sulfur and nitrogen) Nitrogen Mercury Organic pollutants Air Quality “Impairment/Impact” Thresholds: Resource/AQRV change thresholds need to be established (by the NPS) for ecosystem protection How much change will we allow in flora, fauna, soil, water, visibility? (what amount of change constitutes “impairment” or “adverse impact”)
Regionaltrends in precipitationconcentration 1985-99 NADP / NTN data -D.W. Clow and M. A. Mast, USGS
Fertilization Loss of Soil Base Cations Changes in Plant Communities N Saturation Lake Eutrophication Changes in Aquatic Species Loss of Lake ANC (acidification) Pathways and Effects of Excess Nitrogen Deposition N Deposition
Research and monitoring for resource management Process modeling Intensivestudies Long-termmonitoring Synoptic surveys Empirical modeling Populationestimates
US Forest Service lakes monitoring WY CO Long-term lakes Continental Divide National Park National Forest • Synoptic surveys • Long-term monitoring
30 Nitrate in wilderness lakes 20 10 0 Wilderness area
MT MT ID WY ID WY Deposition (kg N/ha) 0 – 0.5 0.5 – 1.0 1.0 – 1.5 UT CO 1.5 – 2.0 UT 2.0 – 2.5 CO 2.5 – 3.0 3.0 – 3.5 NM AZ AZ NM Wet deposition of nitrogen NO3 NH4
WY CO Long-term monitoring sites
Front Range Front Range, Northcentral Colorado • 3-6 kg N / ha wet deposition. • Low retention of inorganic N in terrestrial ecosystem. • Aquatic ecosystem N assimilation:Nitrate 3-5 meq/L lower in outlet. • Many watersheds sensitive to N deposition.
Mount Zirkel, Northwest Colorado • 3-5 kg N / ha wet deposition. • High retention of inorganic N in terrestrial ecosystem. • No leakage of inorganic N from lake. • Organic N: stored or exported? • Most watersheds not highly sensitive to N deposition.
Wind River Wind River, Northwest Wyoming • 1-3 kg N / ha wet deposition. • Moderate retention of inorganic N in terrestrial ecosystem. • Aquatic ecosystem N assimilation:Nitrate 3-5 meq/L lower in outlet. • Many watersheds sensitive to N deposition.
Weminuche, Southwest Colorado • 1-3 kg N / ha wet deposition. • Moderate retention of inorganic N in terrestrial ecosystem. • Aquatic ecosystem N assimilation:Nitrate 3-5 meq/L lower in outlet. • Sensitive to acidification (acid rock drainage).
Nitrogen Emissions sources in the Rockies • Transportation • Electric power generation • Energy development • Agriculture
Mercury in ice core from Upper Fremont Glacier • Remote location in Wyoming, 4000m elevation • 70% of Hg-T deposition during last 100 years from anthropogenic sources. • Peak deposition = 20x background. • Better temporal resolution than sediment cores. -Shuster et al., Environmental Science and Technology, 2002
Mercury Lake sediments, Mount Zirkel Paleolimnological records of deposition. Pesticides Lake sediments, Rocky Mt. NP Mills Lake total DDT (ug/kg) 0 5 10 15 0 5 Depth (cm) 10 15 20 Van Metre, Krabbenhoft, Striegl, and others, USGS