Download
1 / 22
220 likes | 230 Views
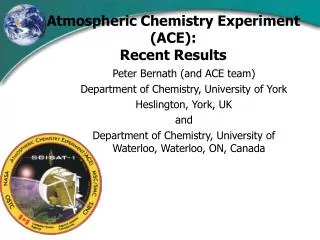
Linelist Needs for the Atmospheric Chemistry Experiment. Chris Boone and Peter Bernath Univ. of Waterloo, Waterloo, Ontario, Canada HITRAN 2006 Conference June 27, 2006. Atmospheric Chemistry Experiment.

E N D
Linelist Needs for the Atmospheric Chemistry Experiment Chris Boone and Peter Bernath Univ. of Waterloo, Waterloo, Ontario, Canada HITRAN 2006 Conference June 27, 2006
Atmospheric Chemistry Experiment • Satellite mission for remote sensing of the Earth’s atmosphere, with a primary focus on Arctic ozone • Developed by the Canadian Space Agency • Launched August 2003, science operations began February 2004 • Operating well, no major problems yet. • Currently funded through April 2007.
Instruments • Infrared Fourier Transform Spectrometer operating between 2 and 13 microns with a resolution of 0.02 cm-1 ( 25 cm MPD) • 2-channel visible/near infrared Imagers, operating at0.525 and 1.02 microns • UV / Visible spectrometer (MAESTRO) 0.285 to 1.03 microns, resolution ~1-2 nm • Suntracker • Startracker
ACE-FTS (ABB-Bomem) Interferometer-side Input optics-side
Excellent SNR Performance Note: after detector decontamination
H2O HITRAN 2004: 7.746e-24, 0.06954 HITRAN 2006: 7.746e-24, 0.0768 DLR: 7.75e-24, 0.0768
Occultation with less water The H2O lineshape problems only occur when working with high water levels (but not high enough for self-broadening parameters to be significant). When one has pressure broadening with lower water levels, the recently determined H2O broadening parameters give improved residuals.
H2O lineshape • Major problems at low altitudes, makes it difficult to perform some retrievals in the lower troposphere. • Voigt lineshape inappropriate? • Variations along the line of sight playing some role? • HITRAN 2006 H2O parameters seem to improve fitting (2 decreases by 4 - 10%)
CFC-113 Even in the low water case, large residuals from water lines complicate retrievals that need to go deep into the troposphere Bad water residual
Version 2.2 Ozone • Validation results: ACE-FTS ozone ~5% low near the profile peak compared to other measurements. • Microwindows in two wavenumber regions: “Cleaner” region given greater weight and pulled the fit. Large residuals in the other region (compared to SNR)
O3 ~3-4% increase between 15 and 50 km, leading to better agreement with other measurements.
O3 parameters • Likely a ~4% discrepancy between the ozone line strength parameters in the two wavenumber regions. • Results from the lower wavenumber region agree better with validation data; suggests a problem with the higher wavenumbers.
HNO3 Improved consistency with the HITRAN 2004 linelist (compared to previous versions), but there remains a significant discrepancy between the two wavenumber regions.
N2 Improved N2 parameters from Aaron Goldman (see his poster for more details).
C2H6 Q-branch Unidentified spectral features in C2H6 fitting microwindow
C2H6 C2H6 Q-branches returned to the linelist, but of poorer quality than the feature near 2976.8 cm-1
COClF Lab spectrum from Kitt Peak, courtesy of Curtis Rinsland
Sparse Cross-Section Data • HNO4: 1 cross-section file, difficult to perform a retrieval • PAN: 2 files (2 different frequency regions) • HCFC-142b: 3 measurements (253, 270, and 287 K). Ideally, the data would go lower in T for atmospheric work • CH3CN: 3 measurements (276.1, 298.7, and 324.1 K). Again, ideally lower T.
Conclusions • Strong push into troposphere: • Improved water • CFCs and HCFCs • Hydrocarbons (e.g., acetone, propane,…) • The listed errors on CO2 line intensities are 2-5%. The accuracy of everything ties back to CO2 (through pressure and temperature). It would be nice to have smaller errors.