Download
1 / 31
310 likes | 312 Views
Spectroscopic Issues for the Atmospheric Chemistry Experiment (ACE). Chris Boone, Kaley Walker, and Peter Bernath HITRAN meeting June, 2008. Atmospheric Chemistry Experiment. Satellite mission for remote sensing of the Earth’s atmosphere, with a primary focus on Arctic ozone

E N D
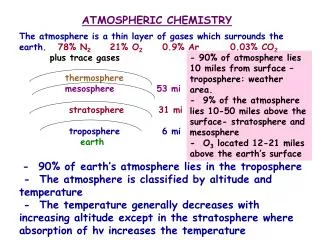
Spectroscopic Issues for the Atmospheric Chemistry Experiment (ACE) Chris Boone, Kaley Walker, and Peter Bernath HITRAN meeting June, 2008
Atmospheric Chemistry Experiment • Satellite mission for remote sensing of the Earth’s atmosphere, with a primary focus on Arctic ozone • Developed by the Canadian Space Agency • Launched August 2003, science operations began February 2004 • Operating well, no major problems yet. • Currently funded through April 2009.
Instruments • Infrared Fourier Transform Spectrometer operating between 2 and 13 microns with a resolution of 0.02 cm-1 ( 25 cm MPD) • 2-channel visible/near infrared Imagers, operating at0.525 and 1.02 microns • UV / Visible spectrometer (MAESTRO) 0.285 to 1.03 microns, resolution ~1-2 nm • Suntracker • Startracker
ACE-FTS (ABB-Bomem) Interferometer-side Input optics-side
SNR Courtesy of Ryan Hughes
CO2 microwindows Discarded 14 CO2 microwindows.
Scale CO2 microwindows? Retrievals from a single microwindow, average of 95 occultations HITRAN Scaled intensities Sticking with HITRAN.
HNO3 Internal Consistency June 2008, verifying that we used the updated HNO3 parameters From November 2007 Reduce all HNO3 line intensities in the 1700 cm-1 region by 8.5% for version 3.0 processing.
CF4 residuals Large residuals from HNO3. Similar issues with ClONO2.
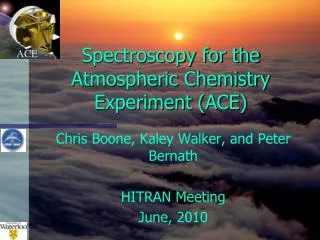
Geoffrey Toon Jet Propulsion Laboratory California Institute of Technology In July 2006, HITRAN released a complete replacement for HNO3, based on the work of Flaud et al., [2006] “MIPAS database: Validation of HNO3 line parameters using MIPAS satellite measurements”, ACP, 6, 5037-5048, 2006 How well does this new linelist describe the HNO3 absorption? HNO3Spectroscopy Evaluation
458.2 nu9 580.3 nu7 646.8 nu6 763.2 nu8 879.1 nu5 896.4 2nu9 1031.5 nu7 + nu9 1100.4 nu6 + nu9 1166.3 2nu7 1205.0 nu8 + nu9 1224.6 nu6 + nu7 1288.0 2nu6 1303.2 nu4 1326.2 nu3 1334.6 nu5 + nu9 1340.8 nu7 + nu8 1407.2 nu6 + nu8 1456.5 nu5 + nu7 1515.8 nu5 + nu6 1533.3 2nu8 1639.0 nu5 + nu8 1709.6 nu2 1756.7 2nu5 1757.9 nu4 + nu9 1789.2 nu3 + nu9 1879.7 nu4 + nu7 1902.7 nu3 + nu7 1918.1 nu4 + nu6 1949.1 nu3 + nu6 2061.3 nu4 + nu8 2092.2 nu3 + nu8 2140.5 nu2 + nu9 2177.9 nu4 + nu5 2200.9 nu3 + nu5 2285.3 nu2 + nu7 2351.7 nu2 + nu6 2467.9 nu2 + nu8 2583.5 nu2 + nu5 2601.2 2nu4 2624.1 nu3 + nu4 2645.1 2nu3 3006.8 nu2 + nu4 3029.7 nu2 + nu3 3412.4 2nu2 3551.7 nu1 4006.9 nu1 + nu9 4123.7 nu1 + nu7 4190.1 nu1 + nu6 4306.3 nu1 + nu8 4421.9 nu1 + nu5 4845.2 nu1 + nu4 4868.1 nu1 + nu3 5250.8 nu1 + nu2 7089.2 2nu1 HNO3 ground-state bands Bold indicates present in July 2006 HITRAN update
Fits to MkIV balloon spectra acquired at 22-23 km tangent altitude inside the polar winter vortex showing various missing HNO3 bands. Examples of missing HNO3 bands nu1+nu9 nu1 2nu3
July 2006 HNO3 update is an improvement on HITRAN 2004: • Reduced inconsistencies between 900 and 1700 cm-1 bands • Improved fits to the 900 and 1200 cm-1 regions • Introduced a J-dependent widths (900 cm-1 region only) • But serious deficiencies remain: • nu3 band at 1300 cm-1 (the strongest) is still problematic • Strength of 1205 cm-1 band is too small (20%) • No lines above 1770 cm-1 (e.g. nu1 fundamental at 3550 cm-1) • Missing the vast majority of overtone and combination bands, • Missing most hot bands and all heavy isotopologs • HNO3 widths are all constant, except for the 900 cm-1 region • HNO3 spectroscopic deficiencies are a major obstacle to further progress in the use of solar occultation spectra to measure or detect trace gases (e.g. SO2, HDO, H2CO, HOCl, OH, HO2) HNO3 Summary (Geoff Toon)
Pseudolines COCl2 COClF Eventually want real spectroscopic parameters (or cross sections) for these molecules. For now, pseudolines allow retrievals.
H2O spectroscopic parameters • Below about 15 km, H2O lines in the ACE-FTS spectra exhibit bad w-shaped residuals. • At least partially deviations from the Voigt lineshape, but there could also be a contribution from poor spectroscopic parameters (very weak lines). • Very bad consistency between lines. • Determine parameters from the ACE-FTS spectra (not the ideal solution).
H2O (continued) • Parameters of interest are the pressure broadening (including a temperature dependence), intensity, and pressure shift. • Using many different occultations, initially attempted to determine both broadening parameter and its temperature dependence, but that didn’t work out well (took a week to converge, sometimes didn’t converge). • Fix temperature dependence (HITRAN). • Choose a single line for “calibration.”
HITRAN: pbhw = 0.0927 NEW: pbhw = 0.1000 All residuals shown are from sr10909 (a tropical occultation).
Does changing broadening parameters affect VMR? Change intensity by ~3%? Still debating this one.
Use the line at 1987.34 cm-1 to calibrate those at lower altitudes. Note: minimal occultation set. Final values will be derived from a set of 95 tropical occultations Simultaneously fit with the line at 1987.34 cm-1 using multiple rays across the field of view. before HITRAN: pbhw = 0.0845, strength = 6.21e-24, pshift = 0.00151 NEW: pbhw = 0.1004, strength = 6.71e-24 (+8%), pshift = -0.0190 after
Internal consistency? Note: different # of data points averaged for the two lines for this altitude The line at 1987.34 cm-1 would have been more consistent with the other two strong lines without the change in broadening parameter.
before H2O after HITRAN: pbhw = 0.0814, strength = 1.4e-24 NEW: pbhw = 0.0986, strength = 2.83e-24 (+102%)
HITRAN: pbhw = 0.0702, strength = 2.98e-24 NEW: pbhw = 0.0877, strength = 4.09e-24 (+37%)
H2O summary • Huge changes in intensities for the lines used to retrieve H2O at lowest altitudes. • Generate parameters from 95 tropical occultations (instead of just 4). • H2O is an interference for a lot of other molecules in the troposphere. Try to improve the spectroscopic parameters for those H2O lines as well.
CH4 line mixing? Red curve is the contribution in the window from NO2. Line mixing in weak CH4 lines could yield problems with low altitude NO2, HCl, and CH4, plus weak absorbers H2CO, CH3Cl, acetone,….
C2H6 Red curve is the C2H6 contribution in this window, calculated from Geoff Toon’s pseudolines. No C2H6 data near 2967 cm-1 for HITRAN (including C2H6 update). Residuals in CH3Cl window (near 2967 cm-1) without C2H6. Lack of C2H6 in calculated spectrum yields overestimate of CH3Cl
CFC-12 Near 922 cm-1 Near 1161 cm-1 ?
Lineshape problem in CO? CO lines
HCl calibration? HITRAN HCl Residuals with HCl line 2981.0017 2981.0001 cm-1 HCl problem or other molecules? 2703.0114 2703.0098 cm-1 2752.0364 2752.0346 cm-1
Summary • HNO3 problems. Internal consistency. Bad residuals degrading results for other molecules, preventing SO2 retrievals. • HNO3 pseudolines to allow SO2 retrieval? • H2O weak lines exhibit poor internal consistency, causes accuracy problems with ACE tropospheric H2O retrievals. • Fix C2H6, especially missing data regions. • CH4 line mixing parameters for weak lines.