Download
1 / 47
480 likes | 661 Views
Atmospheric chemistry. Lecture 5: Polar Ozone Holes & Arctic Haze. Dr. David Glowacki University of Bristol,UK david.r.glowacki@bristol.ac.uk. Over the last 4 days…. We’ve discussed: Atmospheric structure & transport Chemical kinetics Tropospheric oxidation chemistry

E N D
Atmospheric chemistry Lecture 5: Polar Ozone Holes & Arctic Haze Dr. David Glowacki University of Bristol,UK david.r.glowacki@bristol.ac.uk
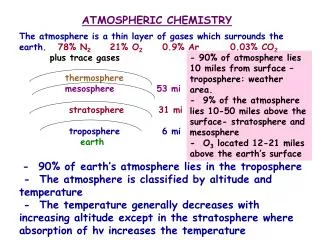
Over the last 4 days… • We’ve discussed: • Atmospheric structure & transport • Chemical kinetics • Tropospheric oxidation chemistry • Stratospheric O3 chemistry Today we’re going to put the pieces together to understand… • Stratospheric Polar Ozone holes (1995 Chemistry Nobel Prize) • Arctic Haze (particularly bad in the Northern Hemisphere)
Polar Ozone Holes: Why do we Care? • The EPA estimates that 60 million Americans born by the year 2075 will get skin cancer because of Ozone depletion • UV exposure also harms plants & animals
October 2000 “For the Second time in less than a week dangerous levels of UV rays bombard Chile and Argentina, The public should avoid going outside during the peak hours of 11:00 a.m. and 3:00 p.m. to avoid exposure to the UV rays” Ushaia, Argentina The most southerly city in the world
Arctic O3 measurements above Spitzbergen Ozone loss does appear in the Arctic, but not as dramatic Some years see significant depletion, some years not, and always much less than over Antarctica
Catalytic ozone destruction The loss of odd oxygen can be accelerated through catalytic cycles whose net result is the same as the (slow) 4th step in the Chapman cycle Uncatalysed: O + O3 O2 + O2k4 Catalysed: X + O3 XO + O2 k5 XO + O X + O2 k6 Net rxn: O + O3 O2 + O2 X is a catalyst and is reformed X = OH, Cl, NO, Br (and H at higher altitudes) • Yesterday, we discussed OH & NO catalyzed loss • What about Br & Cl catalyzed loss?
Catalytic O3 loss via Br Br + O3 BrO + O2 Cl + O3 ClO + O2 ALSO BrO + ClO Br + ClOO ClOO Cl + O2 Net 2O3 3 O2 Br and Cl are regenerated, and cycle does not require O atoms, so can occur at lower altitude Sources of bromine: CH3Br (natural emissions from soil and used as a soil fumigant) Halons (fire retardants) Catalytic cycles are more efficient as HBr and BrONO2 (reservoirs for active Br) are more easily photolysed than HCl or ClNO3 But, there is less bromine than chlorine Br BrO Br BrO
CFC measurements Pt Barrow Niwot Ridge Mauna Loa Am Samoa Cape Grim South Pole
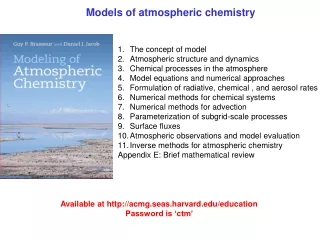
Global CFC Emissions Data from NOAA CMDL Ozone depleting gases measured using a gas chromatograph with an electron capture detector (invented by Jim Lovelock) These are ground-based measurements. The maximum in the stratosphere is reached about 5 years later Values in the N hemisphere slightly higher
CFC transport CFC’s are not destroyed in the troposphere. They are only removed by photolysis once they reach the stratosphere.
Simultaneous measurements of ClO and O3 on the ER-2 Late August 1987September 16th 1987 Still dark over Antarctica Daylight returns Gas phase chemistry alone cannot explain these observations
Polar Stratospheric Clouds • PSC solid phases: • PSCs catalyze the conversion of ClNO3 (a Cl reservoir) to Cl2 (and eventually Cl) • Formation is more likely in the Antarctic because of Lower T
O3 depletion within the Antarctic vortex In the southern hemisphere, strong westerly winds arise from Coriolis forces because there is little land to induce turbulent mixing This results in a south polar cell (vortex) which is more isolated from southern mid-latitudes than the northern polar cell, and extreme temperature gradients – especially in winter ClO+BrO Cl+Br+O2
Arctic Haze Possible exam trick question: Identify Los Angeles
Observations of Arctic Haze • First observed in the 1950s during US military weather observation flights from bases in Alaska to the high Arctic G.E. Shaw, “The Arctic Haze Phenomenon”, Bull. Am. Met. Soc., 1995, 76(12), p 2403-2413
Arctic Haze: Pollutant Transport & buildup • Pollutants from lower latitudes are transported to the Arctic are oxidized during arctic summer • During polar winter, OH oxidation ceases • Cold temperatures make the arctic boundary layer very stable during winter, dramatically slowing mixing
Arctic Haze: Pollutant Transport & buildup • Typical VOC profiles will look something like this • Peroxyacetylnitrate can transport NO2 long distances from source
Arctic Haze: In the polar spring the sun returns… • The boundary layer temperatures increase • OH production begins • NO2 is released from its reservoirs • [O3] and [RO2], and [RO] increase rapidly • The chemical reactor turns ON, making a mixture of reactive chemicals and sticky peroxy radicals that can react with gas phase and aerosol species
NO2 NO OH HO2 oxidation product VOC RO2 RO NO NO2
NO2 NO OH HO2 oxidation product VOC RO2 RO O2 NO NO2
NO2 NO OH HO2 oxidation product VOC RO2 RO NO NO2
NO2 NO OH HO2 oxidation product VOC RO2 RO NO NO2 O2 O3 sunlight
NO2 NO OH HO2 oxidation product VOC RO2 RO O2 NO NO2 O3
NO2 NO OH HO2 oxidation product VOC RO2 RO NO NO2 O3
O3 sunlight O2 NO2 NO OH HO2 oxidation product VOC RO2 RO NO NO2 O3
O3 NO2 NO OH HO2 oxidation product VOC RO2 RO O2 NO NO2 O3
O3 NO2 NO OH HO2 oxidation product VOC RO2 RO NO NO2 O3
O3 NO2 NO OH HO2 oxidation product VOC RO2 RO NO NO2 O2 O3 sunlight O3
O3 NO2 NO OH HO2 oxidation product VOC RO2 RO O2 NO NO2 O3 O3
O3 NO2 NO OH HO2 oxidation product VOC RO2 RO NO NO2 O3 O3
O3 sunlight O3 O2 NO2 NO OH HO2 oxidation product VOC RO2 RO NO NO2 O3 O3
O3 O3 NO2 NO OH HO2 oxidation product VOC RO2 RO O2 NO NO2 O3 O3
O3 O3 NO2 NO OH HO2 oxidation product VOC RO2 RO NO NO2 O3 O3
O3 O3 NO2 NO OH HO2 oxidation product VOC RO2 RO NO NO2 O2 O3 sunlight O3 O3
O3 O3 NO2 NO OH HO2 oxidation product VOC RO2 RO O2 NO NO2 O3 O3 O3 O3
O3 O3 NO2 NO OH HO2 oxidation product VOC RO2 RO NO NO2 O3 O3 O3 O3
O3 O3 sunlight O3 O2 NO2 NO OH HO2 oxidation product VOC RO2 RO NO NO2 O3 O3 O3 O3
O3 O3 O3 NO2 NO OH HO2 oxidation product VOC RO2 RO O2 NO NO2 O3 O3 O3
ARCTIC HAZE!!!!!!!!! O3 O3 O3 NO2 NO OH HO2 oxidation product VOC RO2 RO NO NO2 O3 O3 O3
Conclusions • The change in light conditions from polar winter and polar summer makes for some crazy polar pollution • Atmospheric transport, kinetics, and sunlight influence both stratospheric ozone loss and arctic haze • The different properties of the arctic and antarctic make for different chemistry