Download
1 / 20
200 likes | 436 Views
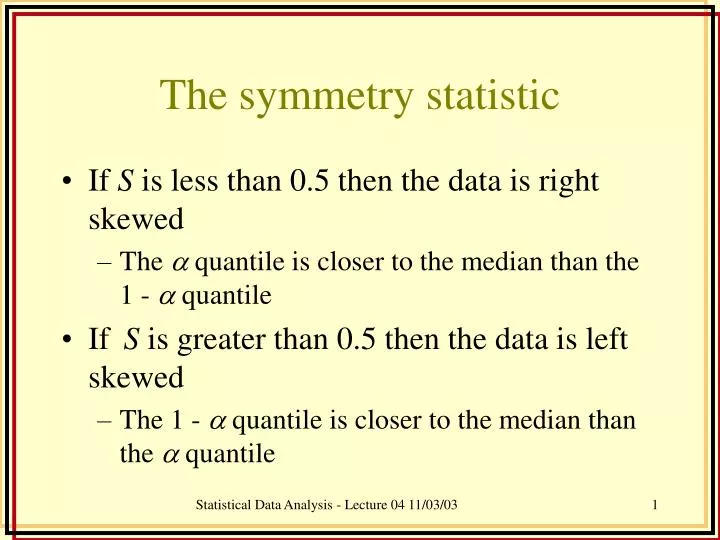
The symmetry statistic. If S is less than 0.5 then the data is right skewed The quantile is closer to the median than the 1 - quantile If S is greater than 0.5 then the data is left skewed The 1 - quantile is closer to the median than the quantile. . d 1 = m - q

E N D
The symmetry statistic • If S is less than 0.5 then the data is right skewed • The quantile is closer to the median than the 1 - quantile • If S is greater than 0.5 then the data is left skewed • The 1 - quantile is closer to the median than the quantile Statistical Data Analysis - Lecture 04 11/03/03
d1= m - q d2= q1- - q 2d1 < d2 S = d1/d2 < 0.5 d1 d2 2d1 > d2 S = d1/d2 >0.5 d1 d2 Statistical Data Analysis - Lecture 04 11/03/03
Data description and transformation continued. Note: for p < 0 we must transform the data x to –xpto preserve the order of the data. Box-Cox transformations • Box-Cox transformations try to make the data more normal • Box-Cox method assumes data raised to some power p, comes from a normal distribution with mean and std. dev. • To find p, and we use maximum likelihoodestimation (mle) Statistical Data Analysis - Lecture 04 11/03/03
Box-Cox transformations Minimise: This is a “profile likelihood” – which you might learn about in the third or fourth year. YOU DO NOT NEED TO REMEMBER THIS OR EVEN KNOW HOW IT WORKS! Typically this is minimised using a graphical method or by some sort of numerical optimisation routing. R can do both. A routine to perform this, is available on the web page and from the server. Statistical Data Analysis - Lecture 04 11/03/03
Transformations - summary • Only works on positive data • Box-Cox usually works well • Make sure you can explain your transformation • Taking the log often is the easiest thing to do • Don’t transform if you don’t need to! Statistical Data Analysis - Lecture 04 11/03/03
Symmetry and skewness measures • We’ve seen the symmetry statistic S. • Robust to outliers • Crude symmetry statistic can be obtained using the quartiles. These can be gained in R by typing: quantile(x) • For the standard symmetry statistic, there is a function called s in the file called symmetry.r on the web and in the course folder. We type s(x) Statistical Data Analysis - Lecture 04 11/03/03
Skewness statistic • Traditional measure of skewness is defined as: • where s is the sample standard deviation. This is sometimes called the 3rd central moment (the variance is the second) • If this statistic is positive, then the data are right skewed and • if it is negative then they are left skewed. Statistical Data Analysis - Lecture 04 11/03/03
Quantile plots • Box-Cox transformations try to “transform to normality” • Is there any way we can find out whether the data behave as though they came from a normal distribution? • Yes – a normal quantile plot or a norplot. Statistical Data Analysis - Lecture 04 11/03/03
Norplots • Define the quantiles of a standard normal distribution N(0,1) If the data come from a standard normal distribution then the empirical quantiles will be in approximately the same position as the theoretical quantiles Statistical Data Analysis - Lecture 04 11/03/03
Example of a norplot Statistical Data Analysis - Lecture 04 11/03/03
Norplots • What happens if the data don’t come from a standard normal? • Remember that if Y~N(,) and Z~N(0,1) then • Therefore if the data are normal, but not standard normal, the data will have slope and intercept Statistical Data Analysis - Lecture 04 11/03/03
Quantile Plots • It is relatively easy to construct quantile plots for any of the standard distributions. • However, the parameters are often unknown and so most people don’t bother for anything other than a uniform distribution • Sometimes, however, we wish to see if two sets of data are similarly distributed Statistical Data Analysis - Lecture 04 11/03/03
QQ-Plots • QQ or quantile-quantile plots compare the quantiles of two sets of data • If the data sets are similarly distributed then then quantiles will be similar and hence the points will cluster around the 45° line • If the data sets have the same spread but differing means the relationship will be linear but the intercept will be different from zero • If the data sets have the differing means and spreads the relationship will be linear but the slope will be different from 1 and the intercept non-zero Statistical Data Analysis - Lecture 04 11/03/03
Constructing a QQ-plot • Let X represent data set 1, and Y data set 2. • If X and Y are of equal length then we can plot the order statistics of X vs. the order statistics of Y • If nx > nY then we need to interpolate the quantiles from Y with Statistical Data Analysis - Lecture 04 11/03/03
QQ-Plot – different distributions Statistical Data Analysis - Lecture 04 11/03/03
Some points about QQ-plots • Easier to interpret if aspect ratio is 1:1 • Good for detect mean and variance/std. dev. shifts • Not really convincing evidence against normality (need a lot of data) • Heavy curvature usually means the data sets are from different distributions Statistical Data Analysis - Lecture 04 11/03/03