Download
1 / 38
380 likes | 514 Views
Policy and Science have Complementary Roles in Mitigating Climate Change. Case #1: Stratospheric Ozone Depletion and the Montreal Protocol. The Antarctic Ozone Hole. The Antarctic Ozone Hole continues to grow in size – in 2000 it was larger than North America! . The Antarctic Ozone Hole.

E N D
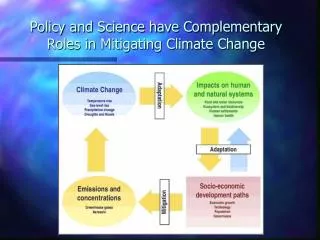
Policy and Science have Complementary Roles in Mitigating Climate Change
Case #1: Stratospheric Ozone Depletion and the Montreal Protocol
The Antarctic Ozone Hole The Antarctic Ozone Hole continues to grow in size – in 2000 it was larger than North America!
The Antarctic Ozone Hole Simultaneously, the ozone depletion increases in severity, reaching nearly 100% at certain altitudes in 2000.
Not only is the Ozone Hole getting larger, but it persists for longer times
Effects of the Montreal Protocol on Atmospheric Cl and Br Loading 1985 – Vienna Convention Organizes the international effort to ban CFC’s 1987 – Montreal Protocol Reduce CFC production to 50% of 1986 levels by 1998 1990 – London Ban on all CFC production by 2000 Accelerated phase-out of replacement gases 1992 – Copenhagen, 1997 Montreal, 1999 – Beijing Halons, CCl4, CH3Br to be eliminated by 2005
Future O3 Levels • The threshold level for Antarctic ozone hole formation is ~ 2 ppb Cl • The first Antarctic ozone holes were observed in the mid 1980’s • Atmospheric Cl loading peaked in ~1996 at 3.3 ppb and appears to be decreasing • Current models indicate recovery by ~ 2050 ± 10
Lessons Learned from the Montreal Protocol Process • Subsequent acceleration of the ODP phaseouts were made based on the continued improvement of remote sensing data and model forecasts • These accelerations in schedule were crucial for avoiding even larger long-term impacts • Action prior to 1987 (13 year delay from initial warnings) may have averted occurrence of the Antarctic ozone hole The Montreal Protocol process serves as the paradigm for effective interaction between science and policy in dealing with global climate change issues.
Case #2: Greenhouse Gas Emissions and the Kyoto Protocol Process
CO2 Temp The Link Between CO2 and Global Warming There is a clear correlation between the geologic CO2 record (TOP) and the geologic surface temperature record (BOTTOM) over the last 1000 years. State-of-the-art global climate models forecast that future increases in atmospheric CO2 levels will be linked to corresponding increases in the mean global surface temperature. The question of HOW MUCH will temperatures increase is based on model assumptions and estimated CO2 levels.
Recent Surface Temperature Variations Surface temperatures have shown significant fluctuation over the last 1000 years. However, the trend since 1800 has been steadily increasing. Temperatures rose ~ 0.6° C over the last century with land areas heating more than the oceans. Note that the increases in the 1900’s occurred abruptly. The cause of these changes is still debated although it can be captured reproducibly in the most sophisticated models.
The Effects of Increasing Surface Temperatures Surface temperatures may increases may be expressed in terms of the mean (average) temperature or temperature variance A uniform increase in mean temperature would cause all areas to become hotter. Increases in the variance of surface temperatures would lead to more extreme weather conditions and more unstable events (storms, ENSO, monsoons, etc) Increasing mean and variance would lead to warmer and more volatile global weather patterns.
Climate Change Scenarios The IPCC 2001 report uses several different scenarios as the basis for its forecasts The scenarios balance different drivers: Economic vs Environmental Global vs Regional
The Impacts of Atmospheric CO2 Loading Extend Far into the Future The timescales for recovery from atmospheric CO2 loading are 100 – 1000+ years due to the slow reaction times and large thermal inertia of the oceans and ice caps
Modeling Surface Temperature Change: Regional vs. Global Models forecast significantly larger effects at high latitudes than near the equator and larger effects in the Northern Hemisphere than in the Southern Hemisphere.
Global Climate Models Capture Surface Temperature Variations
Modeling Global Temperature Change Models do well capturing the past behavior of the climate, but diverge on their forecasts of future temperatures. The uncertainties in these forecasts presents the most probable range of temperatures that one might associate with different scenarios. Compare the forecasted changes in temperature for 2100 with the 0.6° C rise in global mean surface temperature from 1900-2000.
Uncertainty in Global Warming Uncertainties exist in the forecasts for potential global warming even for stabilized concentrations of greenhouse gases.
Economic Impact of Different CO2 Stabilization Scenarios The ultimate estimated economic impact of CO2 emissions regulation depends on the target stabilization level chosen.
UNFCCC - ARTICLE 1: DEFINITIONS 1...."Adverse effects of climate change" means changes in the physical environment or biota resulting from climate change which have significant deleterious effects on the composition, resilience or productivity of natural and managed ecosystems or on the operation of socio-economic systems or on human health and welfare. 2...."Climate change" means a change of climate which is attributed directly or indirectly to human activity that alters the composition of the global atmosphere and which is in addition to natural climate variability observed over comparable time periods. 3...."Climate system" means the totality of the atmosphere, hydrosphere, biosphere and geosphere and their interactions. 4...."Emissions" means the release of greenhouse gases and/or their precursors into the atmosphere over a specified area and period of time.
UNFCCC - ARTICLE 1: DEFINITIONS 5...."Greenhouse gases" means those gaseous constituents of the atmosphere, both natural and anthropogenic, that absorb and re-emit infrared radiation. 6...."Regional economic integration organization" means an organization constituted by sovereign States of a given region which has competence in respect of matters governed by this Convention or its protocols and has been duly authorized, in accordance with its internal procedures, to sign, ratify, accept, approve or accede to the instruments concerned. 7...."Reservoir" means a component or components of the climate system where a greenhouse gas or a precursor of a greenhouse gas is stored. 8...."Sink" means any process, activity or mechanism which removes a greenhouse gas, an aerosol or a precursor of a greenhouse gas from the atmosphere. 9...."Source" means any process or activity which releases a greenhouse gas, an aerosol or a precursor of a greenhouse gas into the atmosphere.
UNFCCC ARTICLE 2: OBJECTIVE The ultimate objective of this Convention and any related legal instruments that the Conference of the Parties may adopt is to achieve, in accordance with the relevant provisions of the Convention, stabilization of greenhouse gas concentrations in the atmosphere at a level that would prevent dangerous anthropogenic interference with the climate system. Such a level should be achieved within a time-frame sufficient to allow ecosystems to adapt naturally to climate change, to ensure that food production is not threatened and to enable economic development to proceed in a sustainable manner.
Historical and Projected Global Population & Energy Consumption
Changes in Global Energy Consumption by Region Energy consumption in Asia and Latin America is projected to more than double in the next 20 years! Energy consumption in Africa and the Middle East should not lag far behind Even technologically advanced nations are expected to increase energy consumption by up to 40% in the next 2 decades
Global CO2 Emissions Projections suggest rapid rise in CO2 emissions from Developing Nations, surpassing the emissions from Developed Nations by 2020. CO2 emissions from oil are projected to dominate the anthropogenic contributions over the next 20 years
Global Energy Consumption by Region Industrialized Nations: Energy consumption will continue to rise over the next 20 years Developing Nations: Nearly exponential growth in energy consumption over next 20 years Developing and Industrialized nations projected to have similar energy consumption by ~ 2020 EE = Eastern Europe FSU = Former Soviet Union
Hubbert’s Peak It is thought that global oil production will peak around 2005 and then begin to decline. This forecast is made based on known reserves and the rate of new discoveries. King Hubbert made the first prediction of this type in the 1950’s when he correctly predicted that oil production in the continental US would peak in 1968. The maximum oil production year is thus known as “Hubbert’s Peak”.