Download
1 / 43
430 likes | 443 Views
Diabetes in South Asians: Findings from the MASALA study. Alka M. Kanaya, M.D. Professor of Medicine, Epidemiology & Biostatistics, UCSF MESA SC meeting, 9/17/2014. M ediators of A therosclerosis in S outh A sians L iving in A merica. Context.

E N D
Diabetes in South Asians: Findings from the MASALA study Alka M. Kanaya, M.D. Professor of Medicine, Epidemiology & Biostatistics, UCSF MESA SC meeting, 9/17/2014 Mediators of Atherosclerosis in South Asians Living in America
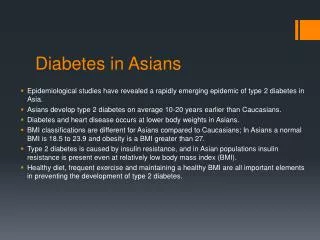
Context • South Asians comprise a quarter of the world’s population. • Second fastest growing racial/ethnic minority in U.S. • 3.4 million U.S. South Asians • 20% of Asian population in the U.S. South Asian countries
DM Prevalence: U.S. vs. India Asian Indian adults: U.S. Indians: 17.4% Urban India: 13.6% Rural India: 8.4% U.S. Whites: 7.8% African Am: 13.0% Latinos: 10.2% Native Am: 15.1% Urban Delhi: 13.6% Rural Tamil Nadu: 8.4% Misra, 2010; Misra; 2011
DM Incidence Rates: Comparing nine U.S. ethnic groups Karter, Diabetes Care, 2012
MASALA Study Aims Establish a prospective community-based cohort of South Asians in the Unites States to: • Determine the traditional, socio-cultural, behavioral, and novel risk factors associated with subclinical atherosclerosis and type 2 diabetes. • Compare the adjusted prevalence of CVD risk factors to the four race/ethnic groups in MESA.
MASALA Ages 40-84 yrs N = 900 Two sites (UCSF and NWU) Pilot study (n=150; 2006-2007) Baseline exam: 2010-2013 MESA Ages 45-84 yrs N = 6,500 6 sites (Columbia, Hopkins, NWU, Minnesota, UCLA, Wake Forest) Started in 2000: exam 5 ended in 2012 Design Kanaya, Clinical Cardiol, 2013
Eligibility Criteria • Inclusion: • Age 40 to 84 years • Self-identify as South Asian • Speak/read English, Hindi, and/or Urdu • Exclusion: (same as MESA) • Prior history of CHD, CVD, CHF, a. fib, angina, cardiac procedures or surgery, PM/defibrillator • Active cancer treatment; <5 y life expectancy • Impaired cognition • Plans to move out of area in next 5 yrs; • Nursing home resident or on waiting list
Clinical Measurements • Weight, height, waist, hip • Seated BP • Ankle-brachial index • 2-hour OGTT; 3 sample (0, 30, 120) • Abdominal CT (visceral/subQ fat) • Basic chemistry, lipoproteins, adipokines • Genetic samples storage (DNA & RNA)
Questionnaire Measures • Sociodemographic information • Medical history; family history • Medication/supplement use • Psychosocial information • Physical activity • Sleep; neighborhood characteristics • Diet-FFQ (SHARE study) • Cultural traditions/health beliefs
Roadmap • Descriptive results • Comparison to MESA groups • Diabetes analyses
MASALA study population Kanaya, Clin Cardiol, 2013
Birth Country 5% 1% 1% 84% 3% Africa 2% U.S. 2% Fiji 2% other Diaspora country 1%
Years and Percent Time in U.S. Average: 27±11 years 0-10 11-20 21-30 31-40 >40 0-20 21-40 41-60 61-80 >80
MESA Comparison * p<0.001 in comparison to South Asians
Socioeconomic status 88% ≥ Bachelor’s 63% ≥ $100,000 % ≤HS <BS =BS >BS <50 50- 100- 150- ≥200 99 149 199
SES: MESA Comparisons * p<0.001 in comparison to South Asians, adjusted by sex and age (excluded South Asians <age 45 years)
Lifestyle Factors * p<0.001 in comparison to South Asians, adjusted by sex and age
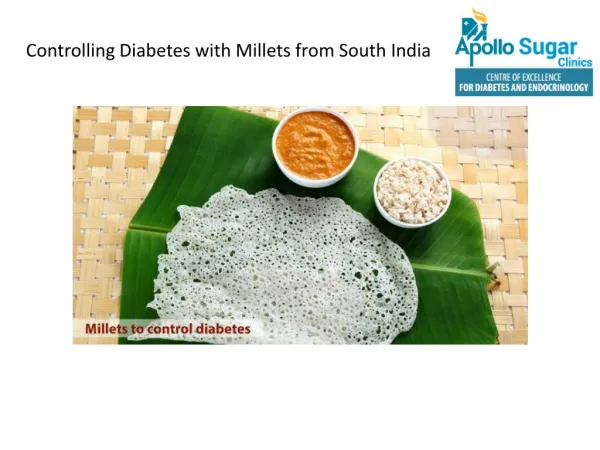
3 Major Dietary Patterns butter, ghee, fried snacks, high-fat dairy, refined grains, rice, potatoes meat, eggs,pasta, pizza,refined grains, alcohol, low-fat dairy, coffee fresh fruit, vegetables, legumes, low-fat dairy, nuts, whole grains Gadgil, ADA poster, 2014
Diet Patterns and Metabolic Risk Factors • Western diet: • Higher BMI and WHR • Sweets & Refined Grains diet: • Higher HOMA-IR and lower HDL Gadgil, ADA poster, 2014
Anthropometry * p<0.001 in comparison to South Asians, adjusted by sex and age
BMI criteria for Overweight/Obesity Lancet, WHO expert panel, 2004
Different BMI criteria Standard criteria WHO-Asian
Yudkin-Yajnik Paradox Lancet, 2004
Anthropometry vs. DXA Shah, Intl Jo Obesity, 2011
More ectopic fat in South Asians * Lower liver attenuation implies higher liver fat † p<0.001 compared to South Asians
Diabetes is Higher in SA Adjusted for age and study site *Diabetes: medication use or fasting glucose ≥126 mg/dl Kanaya, Diabetes Care, 2014
Adjusted prevalence * p<0.05; **p<0.001 compared to South Asians †adjusted for age, sex, clinical site, education, family income, smoking, alcohol use, exercise, BMI, waist circumference, HDL, triglycerides, hypertension, and fasting insulin
* Higher levels of Insulin Resistance ** ** ** ** ** ** ** Lower levels of Beta cell function Adjusted for age, sex, BMI, waist * p<0.05 **p<0.001 compared to SA
Insulin Resistance Beta cell function P-for-interaction = 0.27 P-for-interaction = 0.001 P-for-interaction < 0.001 P-for-interaction < 0.001
Insulin Resistance Beta cell function P-for-interaction = 0.27 P-for-interaction = 0.001 P-for-interaction < 0.001 P-for-interaction < 0.001
Within MASALA analysis Shah, ADA abstract, 2014
What’s next for MASALA? • Second visit now: Social networks focus • Baseline measurements underway: • Pericardial fat and liver attenuation measures • Adipokine assays • Annual f/u for CVD events adjudication • Grant renewal pending: repeat CAC measures • Ancillary studies pending: • metabolomics, GWAS • adhesion molecules
Thank you to the study staff, investigators, and participants of MASALA Funded by NIH/NHLBI grants #1R01HL093009, #K24HL112827, and #1R01HL120725
Pilot Study: MV model for DM Adjusted for sex and age Kanaya, Metab Syn Rel Disord, 2010
Median CAC by Age Kanaya et al, Atherosclerosis, 2014
MV model*: any CACSouth Asians compared to each MESA group *adjusted for sex, age, site, education, smoking, BMI, DM, hypertension, HDL, LDL, and cholesterol medication use P-for-interaction by sex = 0.002 Kanaya et al, Atherosclerosis, 2014
Conclusions Compared to other racial/ethnic groups, South Asian • Men have more coronary calcium than most other groups; but similar to Whites. • Women have similar CAC compared to most other women, but somewhat higher CAC after age 70 than women from other racial/ethnic minority groups. • Need longitudinal follow-up to determine whether CAC (or other plaque characteristics) are associated with ASCVD outcomes.