Download
1 / 17
170 likes | 292 Views
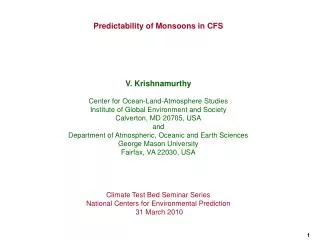
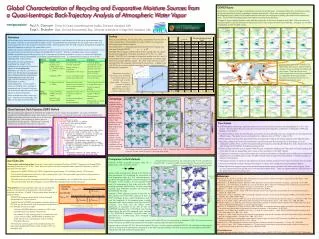
Water vapor sources for Yangtze River Valley rainfall: climatology, variability, and implications for rainfall forecasting. Jiangfeng Wei Center for Ocean-Land-Atmosphere Studies Maryland, USA. Introduction. Yangtze River Valley (YRV) is one of the most densely populated regions in the world.

E N D
Water vapor sources for Yangtze River Valley rainfall: climatology, variability, and implications for rainfall forecasting Jiangfeng Wei Center for Ocean-Land-Atmosphere Studies Maryland, USA
Introduction • Yangtze River Valley (YRV) is one of the most densely populated regions in the world. • Frequent floods caused severe property damage and huge loss of lives. • The decadal precipitation variability over East China is directly related to the changing water vapor transport.
Vectors: The first EOF of 1979-2010 interannual variation of April-September average vertically integrated moisture flux Shading: The correlation of the corresponding first principle component time series (PC1) with precipitation at each grid point
Questions • Where does the water vapor for YRV rainfall come from? • What source regions are most important? • Can we predict the rainfall using information on evaporation at the source regions?
Data • The new NASA reanalysis product Modern Era Retrospective-analysis for Research and Applications (MERRA) is used. • MERRA was generated with the Goddard Earth Observing System (GEOS-5) atmospheric model and data assimilation system, with a particular emphasis on the hydrologic cycle. • Time range 1979-2010, 2/3°×1/2° horizontal resolution and 72 vertical atmospheric levels.
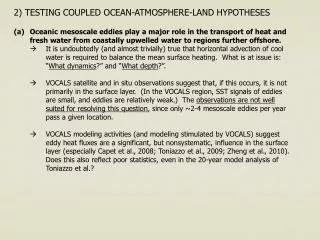
Method Quasi-Isentropic Back Trajectory (QIBT) method For each precipitation event at a grid point, multiple parcels are launched at random humidity-weighed levels. The parcels are tracked backward in time along the isentropic surfaces until all of its original precipitation is attributed to evaporation but no longer than 15 days. Dirmeyer, P. A., and K. L. Brubaker, 1999: Contrasting evaporative moisture sources during the drought of 1988 and the flood of 1993. J. Geophys. Res., 104, 19383–19397. Dirmeyer, P. A. and K. L. Brubaker, 2007: Characterization of the Global Hydrologic Cycle from a Back-Trajectory Analysis of Atmospheric Water Vapor. J. Hydrometeor., 8, 20–37.
Arrows: vertically integrated moisture flux Shading: percentage of evaporative moisture sources supplying rainfall in the box Major moisture sources vary with time, mostly over land.
Most source regions follows the time evolution of rainfall, except the Western Pacific and local YRV. • Moisture from the Bay of Bengal and Western Pacific shows a seesaw relationship.
Pentad relationships during June-July 1979-2010 Color: moisture from YRV that contributes to local rainfall • Recycling ratio is responding passively to the variation of rainfall • Weak control of local surface condition on rainfall
Dominant interannual patterns of evaporative sources EOF1 PC1 Patterns highlight moisture sources most important for YRV rainfall Dipole over the Bay of Bengal and Western Pacific (June-September) Associated time series (PCs) show strong correlations with rainfall
Secondary interannual patterns of evaporative sources EOF2 PC2 Increased local recycling after year 2000 Increasing typhoon impact on YRV rainfall
Interannual correlation between moisture supply from Bay of Bengal and Western Pacific
Critical evaporative sources for YRV rainfall Correlation between YRV rainfall and evaporative moisture supply Product of the first two factors has a good correspondence to EOF1. Patterns of product are similar to EOF1. Large correlations (first factor) over ocean, showing the important role of ocean in the circulation. Results show weak potential of surrounding soil moisture or ET for YRV rainfall forecasts. Percentage of evaporative moisture supply to YRV rainfall Fraction of local ET that contributes to YRV rainfall Product of the above three
Difference between 6 wettest and 6 driest YRV rainy seasons (June-July) Arrows: moisture flux Shading: evaporative moisture supply Patterns of moisture fluxes and evaporative sources are similar to their EOF1, confirming their dominant impact. El Niño-like SST pattern and warmer SST over surrounding ocean may be the main reason for the stronger moisture transport to YRV.
Summary • QIBT method can estimate the evaporative moisture sources of precipitation, which is difficult by only calculating moisture fluxes. • The contributions of major moisture sources and their relative importance show large seasonal variations. The moisture from the Bay of Bengal and the Western Pacific usually compensate each other. • The major direct moisture sources are over YRV and its major moisture transport pathways over land, rather than over the ocean as from the traditional view, but the ocean is important in initiating the moisture transfer. • Over these important land moisture sources, surface evapotranspiration is not controlled by soil wetness and has weak impact on the variability of rainfall. The prediction of YRV rainy season rainfall thus depends more on the knowledge of large-scale circulations and monsoons than land surface conditions. • The local recycling ratio of YRV precipitation and the impact of typhoons both increased after around year 2000.