Download
1 / 29
290 likes | 417 Views
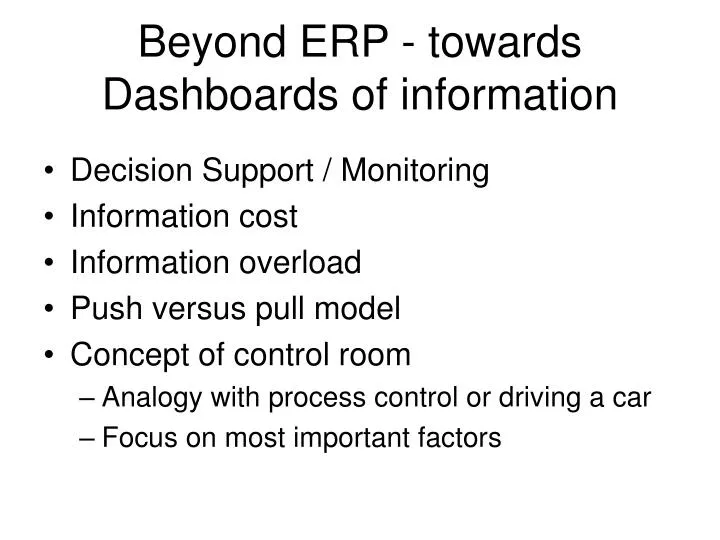
Beyond ERP - towards Dashboards of information. Decision Support / Monitoring Information cost Information overload Push versus pull model Concept of control room Analogy with process control or driving a car Focus on most important factors. CSF - Theory. Definition:

E N D
Beyond ERP - towards Dashboards of information • Decision Support / Monitoring • Information cost • Information overload • Push versus pull model • Concept of control room • Analogy with process control or driving a car • Focus on most important factors
CSF - Theory • Definition: Limited number of areas where satisfactory results will ensure successful competitive performance for the individual, the department or the firm • Monitored on the basis of a set of measures - specific standards that allow the calibration of performance • Measures can be soft or hard - ie: objective or subjective
CSF method diagram • Identification of a hierarchy of performance measures that lead to identification of Critical Factors and Issues that will determine a business’ success The business mission statement The business vision statement multiple business goals multiple business objectives for each goal multiple CSFs for each objective
Implementation: multiple business objectives for each goal multiple CSFs for each objective Central Database - Data Warehouse Data Preparation Layer / Data Mart Dashboard Common Interface Indicators KPI 1 KPI 2 KPI 3 KPI 4
Sources of CSFs • Industry • Competitive strategy and industry position (leader / follower; big / small…) • Environmental factors (eg: economic fluctuations and national government policies) • Temporal factors (temporary CSFs) • Managerial position (more specific to one manager)
Classification of CSFs • Internal versus external • Monitoring versus Building / Adapting (eg: implementing of major corporate plan) • Evolution over time - eg: motor industry
+ / - of the CSF technique • Small number of CSFs • Managers normally aware of them - make them explicit is possible • Specific to firm / dept / manager • But; not all CSFs are measurable at all (access to data) • Known CSFs may be trivial • Time consuming to go beyond the obvious • Will managers make time for CSF analysis?
Dashboards of information • A CSF analysis can be turned into a dashboard of info • indication in real time of what is happening • Concentration on the most important + visual impact (e.g. colour coding) • But data has to be very reliable and design of interface must be good : • three mile island
Some Problems with 3 mile Island • Layout of control not consistent with use of indicators • no consistency on where associated controls are situated or how they operated • layout of controls did not reflect layout of plant • indicators and alarms were not sorted by degree of importance • no consistency in use of colour • Cl: the layout of the dashboard and what indicators represent (+ how they do it) requires much attention
The Control Room • Monitoring complex processes through technology mediated systems • Controlling without seeing directly • Not completely similar to business management • But useful anyway to measure performance in a specific and acccurate fashion
Key issues for dashboard development • Limited attention - selection of indicators (CSF) • Accurate performance measurement - methods (models) and data used • Operator / user training - consensus / awareness • Dashboard layout - avoid confusion / be consistent
Good Food Limited case study Read and Prepare solutions Discussion Conclusions
Framework for dashboard development Question 1: Who will use this indicator? Question 2: Can it be mapped out to a specific objective at a higher level? Question 3: How frequently will managers need to monitor it? Question 4: What calculation methods? What unit of measurement? Question 5: What data source exists? What should be created? Question 6: How detailed should the analysis be? How can the indicators be broken down? Question 7: What threshold values should be used to differentiate between adequate and inadequate performance? What comparisons can be made to assess the company’s performance? Question 8: How can it be represented for maximum visual impact? Question 9: What action must be taken when good or bad performance is measured? Question 10: How will it be monitored / archived in the long term Question 11: Is there any potential bias with the methods and data used for calculations? What incentives may be given to organizational actors?
Overall method • Rigorous procedures for reporting and monitoring • Set up a complete Budget framework • Budget broken down per responsibility - e.g. buyers give prices, production gives productivity • once a year = > budget put together • expected levels are put proposed by each area • full report compiled (p/l for the year ahead) • negotiated with top management • final budget used to benchmark activity of the firm
General Indicators • Focus on 3 key indicators compared with budget makes it easier to analyse responsibilities: • volume V (Vb for budget and Va for actuals) • price P • formula F • total variance = Va Pa Fa - Vb Pb Fb • volume variance = Va Pb Fb - Vb Pb Fb = (Va-Vb) Pb Fb • Price variance = Va Pa Fa - Va Pb Fa = (Pa - Pb) Va Fa • Formula variance = Va Pb Fa - Va Pb Fb = (Fa - Fb) Va Pb
Analysing the general indicators • Volume variance : • breakdown per product / market / week • also per rep? • source: budget / weekly sales • who? Sales Director and reps + regional supervisors + MD • colour maps showing areas / markets • threshold values determine colour • volume and € figure
Analysing the general indicators • Price variance: • breakdown per RM / component + labour (for each category) [focus on most expensive] • buyers / production director + supervisors +personnel director • source: budget figures + account payable / payroll • Monthly probably enough (changes don’t occur that often) • tables for detail + exception reporting using icon representing the factor that has high negative variance
Analysing the general indicators • Formula variance: • per product / per RM + labour • source: stock issue dockets + production sheets (sales too late) + labour hours • some figures cannot be known exactly => use surrogate or estimate • target: foremen, production staff and director • gauges, colour map of the factory, exception lists
Monitoring Maintenance • Imagine down time is increasing • don’t know enough to fix the problem (1) collect appropriate data on accidents: • maintenance staff time sheets • accident report for each problem - documented by operators • match both sources of data (2) store it in a suitable DB (3) analyse based on a number of CSF (4) present analysis in computer dashboard
CSF analysis for the maintenance • Number of accidents per run (per unit / product) • Nature of accident (several categories to be found) • Location of accidents • Average duration of repair (for each assembly line) • Average duration of repair for each staff? • Average duration of repair for each type of accident • Mapping of when accidents happen • establish thresholds
Location (% of all accidents) 5% al 1 10% W3 W3 Shipping 10% al 2 8% al 1 WP2 W2 W2 35% Stocks storage al 2 Main Corridor Finished 3% Goods al 1 WP1 W1 W1 6% cooling al 2 Changing 3 - 3 - 15% Other Areas: 2 % Rooms Stocks Preparation ovens and Related RM Quality Facilities Control
Time spent (% of down time) 5% al 1 5% W3 W3 Shipping 20% al 2 41% al 1 WP2 W2 W2 8% Stocks storage al 2 Finished Main Corridor 3% Goods al 1 WP1 W1 W1 4% cooling al 2 Changing 3 - 3 - 8% Other Areas: 2 % Rooms Stocks Preparation ovens and Related RM Quality Facilities Control
Conclusion on Maintenance • Great potential for computerised solution • Some added cost • Focus on: • Actionable areas • Areas where scope for improvement • Communicate with staff • Use for improvement rather than finger pointing • Evolution over time will point to policy decisions
Sales Returns • Limited scope for computerised solutions because no possibility of data capture (in this case) • Technical solution – surrogate what happens to the product in a simulated environment – eg: a fridge • Holding samples of products over complete shelf life at various temperatures • Beyond product resistance – move to reputational systems
Product Portfolio • Little scope for computer support because no data available • No direct contact with customers • Cannot really predict new product acceptance with lag indicators • Customers cannot tell you what they don’t know! • Use consumer panel – focus group(s)
Conclusions • Dual approach on content and context • Realise limitations of computerised solutions when neither data nor model is there • Find surrogates when possible (data) • Be creative in terms of activities that can be pursued to learn more (models) • Focus on delivering value rather than software tools