Download
1 / 5
50 likes | 149 Views
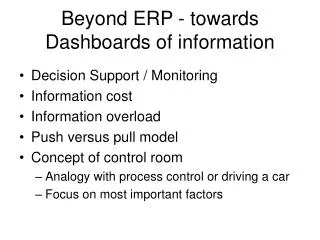
Chapter 10 EXECUTIVE INFORMATION AND DASHBOARDS. Decision Support Systems For Business Intelligence. DSS in Action.

E N D
Chapter 10EXECUTIVE INFORMATIONAND DASHBOARDS Decision Support Systems For Business Intelligence
DSS in Action Medsphere, a leading commercial provider of open source-based electronic health record systems and services for hospitals and clinics, has a strong focus on project management. Program managers are responsible for presenting the overall progress on the company’s projects to their different stakeholders, including board members and customers. However, they did not have a succinct and comprehensive way of communicating the myriad of details to their various stakeholders until they adopted dashboards. Using the full dashboard technology of an EIS, they can now convey information across the organization regarding each customer’s implementation. Two basic dashboards were implemented: • The Project Performance Dashboard helps Medsphere managers, executives and board members quickly obtain an understanding of the progress of customer implementations. For example, they can see at a glance budget and schedule performance that can be used to forecast future performance. continued
DSS in Action Continued • The Project Status Dashboard helps Medsphere managers, executives and board members quickly obtain information on project challenges including burn off and aging status. Of course individual decision makers can customize their dashboard with a variety of measures, including scheduling, actual vs. planned, issues, top 5 challenges, risk management, and earned value management dashboards. Managers at Medsphere note the dashboards have improved communications among employees because they can see and understand the relevant information at the same time. In addition, because they can drill down into the data to find the reason for a particular outcome, it allows decision makers to understand the reason for a result and the items that might be adjusted to improve it.
Design Insights One CEO removed the EIS dashboard, even though it included the right physical interfaces and was implemented on the basis of critical success factors. In her mind, the dashboard was more of a toy than a tool because the CEO lacked any mechanism to share insights from it with others in the company. Since the dashboard lacked any way to be integrated into an email or other communication tool, she had to print the result, comment on it and send it through company mail. In other words, the CIO had no good way to communicate the points while the feeling was ‘hot.’ Integration of the tool into regular work processes is critical.
Design Insights Although fast response time is important to the executive, designers need to be aware that a sudden move to fast information upon which the executives can act can lead to instabilities in the organization. Consider, for example, the experience seen with database technology, as summarized by Chapnic (1989): Information feedback that is too rapid and not controlled properly is very destabilizing for a system, causing its behavior to oscillate wildly ... we may inadvertently destabilize large organizations by forcing them to react too quickly to changes.