Download
1 / 32
330 likes | 502 Views
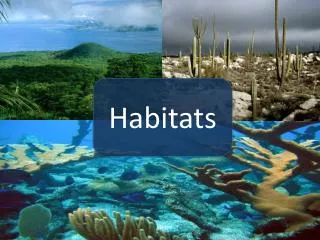
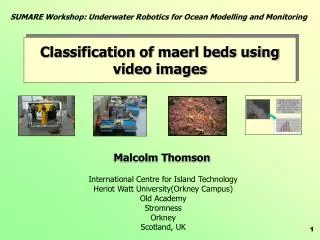
Mapping maerl habitats using autonomous sensors. Malcolm Thomson International Centre for Island Technology (ICIT) Heriot Watt University Old Academy Stromness Orkney UK KW16 3AW e-mail: malcolm.thomson@hw.ac.uk. Maerl habitats. Under ambient light. Under artificial light.

E N D
Mapping maerl habitats using autonomous sensors Malcolm Thomson International Centre for Island Technology (ICIT) Heriot Watt University Old Academy Stromness Orkney UK KW16 3AW e-mail: malcolm.thomson@hw.ac.uk
Maerl habitats Under ambient light
Taking a step back... 50 meters • “patches” of living and dead maerl are natural features of maerl beds
Environmental requirements • Moderate tidal currents, 0.5 - 1.0 ms-1 • Light - occurs in depths generally less than 30 m • Shelter from wave exposure • sheltered bays and sounds • Orkney Islands - numerous shallow tidal channels where maerl is abundant
Why is maerl interesting? • Commercial value • soil conditioner • water filtration and purification • food additive • cosmetics • bone surgery • Conservation value • provides a substrate for other flora and fauna • high species richness • high productivity • nursery area • recognised under EU Habitats Directive (92/43/EEC)
Why map maerl? • Extraction • need to know production rate in order to calculate sustainable extraction rate • to calculate production rate need, inter alia: • area of living maerl on the seabed • locate extraction site in areas of predominantly dead material • Conservation • delineate boundaries of maerl bed • status of a maerl bed, e.g. is it actively growing or a relict (dead) bed • how much living maerl occurs at a site • bed dynamics • how it interacts with local environmental conditions, e.g. tidal currents, depth, wave exposure
Traditional maerl survey • Side scan sonar • RoxAnn survey • not able to measure living or dead deposits directly • Grab samples • Video • diver • towed sled • difficult to manually estimate areas • time consuming data analysis
SUMARE: aims of maerl application • Prove the use of autonomous sensors in mapping the occurrence of maerl in Wyre Sound, Orkney • estimate the area of seabed covered by living and dead maerl at different sites • capture variation in the small-scale distribution of maerl between different sites • Applications in the sustainable extraction of maerl as a commercial resource, and in long-term conservation of maerl as an important marine habitat.
1 km Survey area - Wyre Sound • ~ 5 x 1 km • Depth 5 - 15m • Water currents up to 1.5 ms-1
Existing knowledge for Wyre Sound • Site specific data from the MNCR conducted by the Joint Nature Conservation Committee (JNCC) • No indication of the distribution of maerl over large areas • Initial assumptions that living maerl occurred in large patches with distinct boundaries (proved to be false - required modification of contouring method)
Methods • Video survey using ROV Phantom • image segmentation • contour following
Image segmentation • Aim to develop an algorithm which would automatically distinguish maerl features and segment video footage accordingly • Based on segmentation, possible to estimate the area coverage of different maerl features which appear in the video footage. • living maerl • dead maerl • sand & macroalgae
Image segmentation (cont.) • Maerl features distinguished using their greyscale characteristics • Image is split into different segments using a segmentation algorithm - each segment has significantly different greyscale attributes
Segmentation according to greyscale in a unit of 12 x 12 pixels
Image segmentation (cont.) • Manual analysis of segmented images • assign labels to different segments • living maerl • dead maerl • The area of each label can then be quantified for a given piece of footage Living maerl Dead maerl mixture
Total area / m2 = 210.07 Transect length / m = 44.4 % area Living maerl = 64.6 Dead maerl = 21.2 Mix = 14.2 Macroalgae = -
Total area / m2 = 183.087 Transect length / m = 44.8 % area Living maerl = 34.7 Dead maerl = 45.8 Mix = 19.5 Macroalgae = -
Total area / m2 = 294.382 Transect length / m = 61.5 % area Living maerl = 34.4 Dead maerl = 65.6 Mix = - Macroalgae = -
Image segmentation (cont.) • Rough segmentation occurs in real time, while ROV is collecting video footage • Post-processing involves labelling of segments • Adjustment of segmentation • labelling may vary between sites or depending on local conditions of depth, light availability • produces area estimates for living/dead maerl at different sites • Ground-truthing • requires manual check of mosaic to confirm segmentation • diver survey for set area (not performed) • Sources of error • other features may be captured in segmentation • living maerl - macroalgae • dead maerl - sand
Image segmentation (cont.) • Presentation of data • graphs, used to show how the % of different features varies along the length of a transect • maps, used to show how the % of single features varies between different sites
Image segmentation (cont.) • Image segmentation allows “patch” characteristics to be examined • patch perimeter • patch width • patch intensity • Link patch characteristics with environmental variables • tidal current strength • depth • wave exposure
boolean intensity 2200 Rousay 2000 1800 1600 1400 1200 1000 800 Wyre 600 200 400 600 800 1000 1200 1400 1600 1800 2000 2200 0.1 0.2 0.3 0.4 0.5 0.6 Patch intensity
boolean area 2200 Rousay 2000 1800 1600 1400 1200 1000 Wyre 800 400 600 800 1000 1200 1400 1600 1800 2000 2200 2400 1 2 3 Patch area
boolean perimeter 2400 2200 Rousay 2000 1800 1600 1400 1200 1000 Wyre 800 600 500 1000 1500 2000 2500 0.9 0.8 0.7 0.6 0.1 0.2 0.3 0.4 0.5 Patch perimeter
Contour following • Original idea was to follow boundaries around patches of living or dead maerl • abandoned, patches too small!! • Contouring capability proved for a different marine habitat • seagrass bed - Villefranche sur Mer • Contouring for maerl - still possible in a different context • mapping contours between regions of different statistical properties, e.g. intensity, area, perimeter of living patches of maerl • tested in theory
Conclusions • Expanded knowledge of the 2D distribution of maerl on the seabed • first attempt to directly measure areas of living and dead maerl • Data assimilation • extraction of maerl • located areas of predominantly dead maerl where extraction should occur • information on the amount of living maerl in the area - useful in calculation of extraction rate • maerl conservation • significant occurrence of living maerl - actively growing site • information on site boundaries • statistical information on the distribution of maerl including small-scale patch characteristics, e.g. intensity, area, perimeter, to link to environmental variables