Download
1 / 4
40 likes | 40 Views
The Forex market helps to promote the comparison of different world currencies with each other and their trade.<br><br>Starting to operate in the largest foreign exchange market in the world may seem daunting, at first, since it is normal among beginners. Normally brokers bring with them certain additional support tools that help the trader in his trade.<br><br>However, it is well known that every trader encounters a trading tool that surpasses them all: live forex tables and forex charts.<br>Read Here More!

E N D
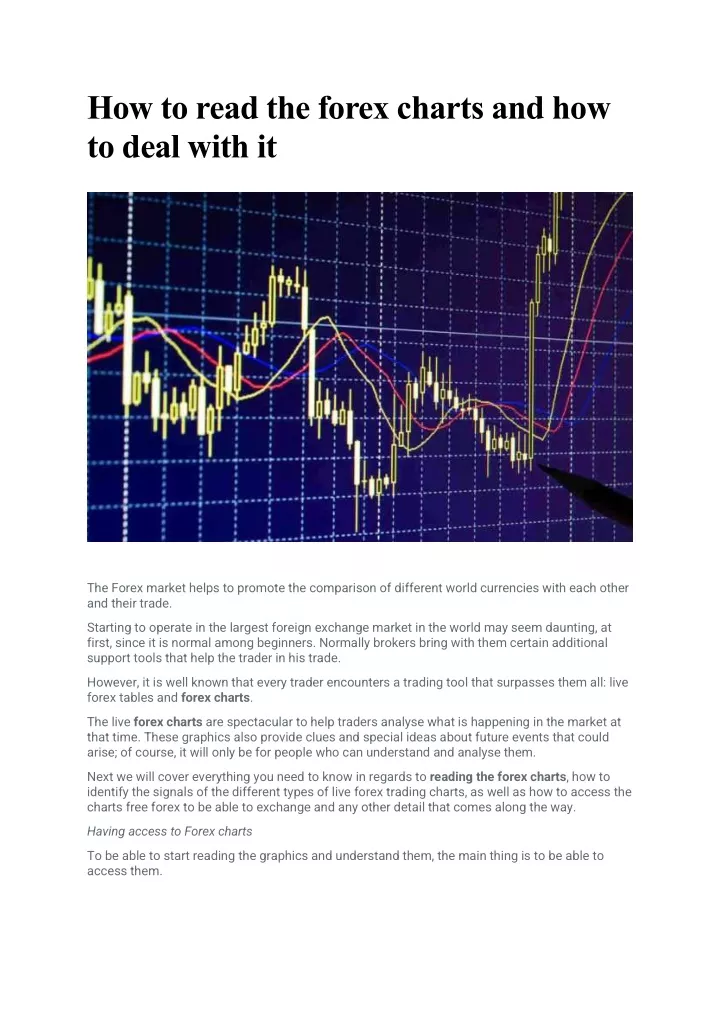
How to read the forex charts and how to deal with it The Forex market helps to promote the comparison of different world currencies with each other and their trade. Starting to operate in the largest foreign exchange market in the world may seem daunting, at first, since it is normal among beginners. Normally brokers bring with them certain additional support tools that help the trader in his trade. However, it is well known that every trader encounters a trading tool that surpasses them all: live forex tables and forex charts. The live forex charts are spectacular to help traders analyse what is happening in the market at that time. These graphics also provide clues and special ideas about future events that could arise; of course, it will only be for people who can understand and analyse them. Next we will cover everything you need to know in regards to reading the forex charts, how to identify the signals of the different types of live forex trading charts, as well as how to access the charts free forex to be able to exchange and any other detail that comes along the way. Having access to Forex charts To be able to start reading the graphics and understand them, the main thing is to be able to access them.
Before you can learn reading forex charts, you must first be able to access them. Their visualisation of them is vital to make business decisions, since here you can see all the buying and selling activity that currently takes place in a market. The MetaTrader platform is one of the best trading platforms that are used by traders in the cryptocurrency exchange market. Then the following platforms offer graphics for free: -MetaTrader 4 -MetaTrader 5 -MetaTrader WebTrader Normally most forex traders start with MetaTrader 4, in which you can download for free to start viewing the free forex charts. It also has a great benefit that is that you can operate directly from the graph that is being viewed. Learning the basics is the most important part First of all, you must put your priorities in order and prepare to read these charts, and then we will show you a series of steps that served as a basic guide to begin. 1. You must have access to the updated information of the currency chart to analyse. Then, to read and benefit from currency charts, you should be able to obtain them from a legitimate provider. Most merchants and minority investors who manage to benefit from online forex trading use charts that are offered directly from their brokerage services. Then new online brokerage services often include tools, such as currency charts, whose main objective is to help their clients understand current prices. 2. Next, you need to select a time frame for your forex chart. It is really important to establish a specific time frame in any financial chart. The values you see are only relevant to the specific time frames that you set for them. Now, with a paper chart, you can cut out the chart for the period of time you have specified, where the online tools usually allow the user to change the view to a specific time period, this can be 1 day, 5 days , 1 month, 3 months, 6 months or 1 year. 3. Proceed to observe your currency chart for the desired time frame. Then you can see a line chart that is responsible for representing the changes in the value of the currency during that period of time. Look at your line chart against your Y-axis. The Y-axis, also called the horizontal axis, for a currency chart with higher frequency, usually indicates an asset price that is comparative. If a line fluctuates, then it shows how your selected currency performs against the currency or asset that is represented on the Y-axis. -Then go to check your X-axis. The X-axis for your currency chart will represent your time frame. Here you can see that both axes have scaled and segmented values, where their line graph fluctuates variably. 4. The last part consists of looking for specific graphic structures. Generally, advanced traders usually look for specific images on a currency chart in order to predict in which direction prices could go in the future. You also need to understand candle charts to be able to take advantage of this advanced financial resource. Candlestick charts are very important and an ace up your sleeve, since they usually show a range of characteristics for a specific trading day, and they also have a top and bottom, that illustrate the movement of prices. Normally many currency charts include
candlestick charts, which are regularly online, and by looking at these charts correctly, you can know much more about the price than under the circumstances of the market, it has changed over a period of time. 5. You can also search for certain items such as the Fibonacci retracement. A Fibonacci retracement is also a specific type of price increase or fall in which a reversal can mean a general trend. The information with which you are always nourished is going to be the most important; you should read about this type of predictive tool and of course, apply it to your observation in the currency chart. It is really important to look for movement against moving averages. Moving averages tell the user how the price has changed in a longer time frame and ultimately, they can be useful the moment you see your currency chart. Different types of charts and how to understand them When we enter Forex, we see the type of change in the live charts, and we find three different options available for the operators that usually use the MetaTrader platform: line charts, bar charts or Japanese candlestick charts. When you are on the MetaTrader platform, you will have the power to switch between these different types of charts. Then you have different options and the possibility to see your graphics depending on the option you use, which could be either OHLC bars or candlestick graphics and finally, we have the third option that offers line graphs. Line charts: The line chart is the one that is responsible for connecting the closing prices of the time period that you are viewing. When you focus on analysing the daily chart, you can see that the line connects the closing price of each trading day. This is the most basic type of chart and is used by most traders from the beginning. It is mainly used to identify image trends that are usually larger, but it does not offer much more, unlike some of the other types of graphics. OHLC Bar Charts: Now we find the OHLC bar graph, this shows a bar for each time period in which the merchant is viewing. Then, when looking at a daily chart, each vertical bar that appears will represent the value of a trading day. In these graphs, we can see a script on the left that represents the opening price and a script on the right that represents the closing price. The maximum of the bar will represent the highest price that the market negotiated during the selected time period. On the other hand we have that the minimum of the bar is the lowest price that the market negotiated during the selected time period. Colours are also distinguished; for example, green bars are known as buyer’s bars because the closing price will be above the opening price. And the red bars are known as vendor bars because the closing price is below the opening price. Candlestick charts: These are similar to OHLC bars in that they also provide the open, high, low values, as well as the closing of a specific time period. The difference is that they have a table between the values of opening and closing prices. They usually provide a variety of price action patterns that are used by merchants around the world Summary
The first time you try to start reading forex charts, everything may seem like chaos. However, understanding the price and time axis will help you determine what has happened historically, and in the future, it will identify what is most likely to happen next. The three types of different graphics have unique characteristics, which need to be studied in a more profound way Blog Source URL: https://cmsprime.com/how-to-read-the-forex-charts-and-how-to-deal-with-it/