Download
1 / 52
520 likes | 526 Views
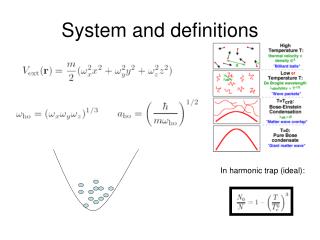
Definitions, History and Infections. September 30 2004 Epidemiology 511 Autumn 2004 W.A. Kukull. Forecasting the future.

E N D
Definitions, History and Infections September 30 2004 Epidemiology 511 Autumn 2004 W.A. Kukull
Forecasting the future • “On the basis of what has happened in the last 30 years…the most likely forecast about the future of infectious disease is that it will be very dull…outbreaks of infections from exotic animals…will doubtless occur in the future but they will presumably be safely contained”.Nobel Laureate, Sir McFarland Burnet, 1972
Definitions of Epidemiology • The study of the distribution and determinants of health and diseases, morbidity, injuries, disability, and mortality in populations. • The study of the distribution and determinants of health-related states or events in specified populations and the application of this study to control of health problems [Gordis]
Assumptions • “Disease” does not occur at random • “Disease” has causal and preventive factors that can be identified through systematic study of populations (persons, places, times) • Factors may be genetic or environmental
Prevention of disease • Primary Prevention: prevent the disease from occurring in a well person • Secondary Prevention: early detection of disease to change the natural history • Tertiary Prevention: reducing disease disability after clinical treatment
Determinants? • Infectious agents • Carcinogens, chemicals • Behaviors/Habits/Lifestyle • Occupational exposures • Aging • Genetic constitution • Socio-political factors
Distribution • Who is affected? • what are their characteristics? • Where are the affected persons? • When are persons affected ? • How many persons are affected? • Is the distribution changing; how?
Population ? • Geographic • Organization Membership • Employment • School • High risk subgroups vs entire Population • Can we enumerate (count) all members?
U.S. counties reportinghumanWNV disease cases, 1999(N = 6 counties)
U.S. counties reportinghumanWNV disease cases, 2000(N = 10 counties)
Incidence of WNME in Humans, by County, United States, 2002* *Reported as of 01/21/2003
U.S. Counties Reporting Human WNV Disease Cases, 2002* 3,862 cases 708 counties 39 states & D.C.
WNV Human Disease Cases, Demographics & Mortality, United States, 1999-2002* * Reported as of 01/21/2003 ** 9% of WN ME cases
Human WNV Disease Incidence, by Age Group and Clinical Category, United States, 2002* * Reported as of 01/21/2003 * *Entire US population
John Snow and Cholera (1) • Snow: vital statistics for 1832 epidemic • higher cholera death rates in areas served by Southwark (11 per 1000 vs. 2 per 1000) • Epidemic of 1848-49: observed similar death rates in areas served by Southwark, and Lambeth water companies • all draw water from same place on Thames
Cholera (2) • William Farr, 1848-49 epidemic: low altitude associated with higher death rate: Miasma or cloud transmitted disease • Snow, 1853: Lambeth water source now moved upstream => Cleaner water • lower death rates in Lambeth service areas: ECOLOGIC design
Materies Morbi: Snow’s hypothesis • Living transmissible agents • small amounts can enter host and multiply • transmitted by contact with patient or fomites • agent can remain dormant, like a seed • can be transmitted great distances while dormant, e.g. by water supply • body portal of entry and exit
Cholera (3) • Snow, 1854 Epidemic, Field epidemiology • 3 water companies served households in the area in a “random” distribution • Determined # of deaths in households served by each water company. • S&V= 71 per 10,000; Lambeth 5 per 10,000 • RETROSPECTIVE COHORT Design
Cholera (4) • 1854 The Broad Street Pump • remove the handle: public policy change • Did cholera cases use Pump? • Did Non-Cases use pump? • Brewery workers • Workhouse inmates • Other pumps • CASE-CONTROL design
Important generalizations: Snow and Cholera • Careful observation of vital statistics • numerators: numbers of events (deaths) • denominators: total persons at risk • calculation of rates • Etiology: causal hypothesis • Exposure ascertainment: field epidemiology • Public policy change
Koch’s postulates • The agent must be recovered from all individuals with disease • Recovered agent must grow in culture • Cultured organism must cause disease in susceptible animal • Agent must be recovered from diseased experimental animal
Revised causal criteria • Temporal relationship • Strength of Association (RR) • Biologic plausibility • Risk factor changes occurrence or severity of disease • Consistency : association is replicated by other investigators • Dose-response
Endemic or Epidemic Cases per 1000 population/time Expected Level Time
The Epidemiologic Triad of a Disease Host Vector Agent Environment
Influenza A epidemic excess mortality in U.S. • A/Japan/57 (H2N2) 1957-58 69,800 • A/Japan/62 (H2N2) 1963 43,200 • A/HK/68 (H3N2) 1968-69 33,800 • A/Eng/72 (H3N2) 1972-73 24,800
Influenza • Surface Antigens: Hemagglutinin; Neuraminidase • Antigenic Shift: MAJOR changes in H, N • May cause pandemics • Antigenic Drift: MINOR changes in H, N • RNA mutation • Change in antigenicity but not serotype
Antigenic Drift • A/Sidney/5/97 H3N2 • Many variants of H3N2 since 1968 • A/New Caledonia/20/99 H1N1 • Over 66% of H1N1 strains isolated in 1999-2000 were antigenically different from previous • Included in 2000-01 vaccine
Natural Hx of infection Observable illness Outcome Treatment Infection Exposure Incubation period Pre Clinical period Clinical Period
Outbreak Investigation (1)Define the epidemic • Define the numerator (cases) • Clinical features • Culture, serology • other causes • Define denominator • population at risk; susceptibles • Calculate Attack Rates
Outbreak investigation (2)Distribution of cases • Time-Place interactions • Characteristics of persons; risk subgroups • Combinations of relevant variables • cross-tabulation of attack rates • Develop hypotheses • existing knowledge of disease (if any) • analogy to known diseases
Outbreak investigation (3) • Test Hypotheses • Calculate ratios of Attack rates • Further analyze existing data • Collect additional data • Recommend Control Measures • Control present outbreak • Prevent future outbreaks
Critical Questions • When did exposure take place? • When did disease begin? • What was disease incubation period? • If we know any two answers, we can calculate the answer to the other.
Herd Immunity • Number of susceptibles • Does infection induce persistent immunity? • Is agent restricted to single host--humans? • Is transmission relatively direct? • High proportion immune protects others • Vaccine programs • lack of susceptibles limits spread
Attack Rates Attack Rate = Number of people at risk who develop illness Total number of people at risk Secondary Attack Rate = Number of contacts developing disease within one incubation period Total number of susceptible contacts Measure of the disease’s tendency to spread in a population
Distribution of SARS cases by days since exposure Average days estimates incubation period
Time before hospital admission after symptoms had occurred
Secondary Attack Cases (SSE= super spreading event)
Attack Rates(% who became ill) Which one is the cause of illness?
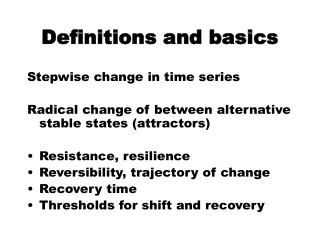
Emerging Infections:newly appeared or has existed but is rapidly increasing in incidence or geographical range • Promoters of pre-existing pathogens • Ecologic changes; shifts in human populations • International travel/commerce • changing industry and technology • microbial adaptation; lapses in public health system