Download
1 / 42
420 likes | 422 Views
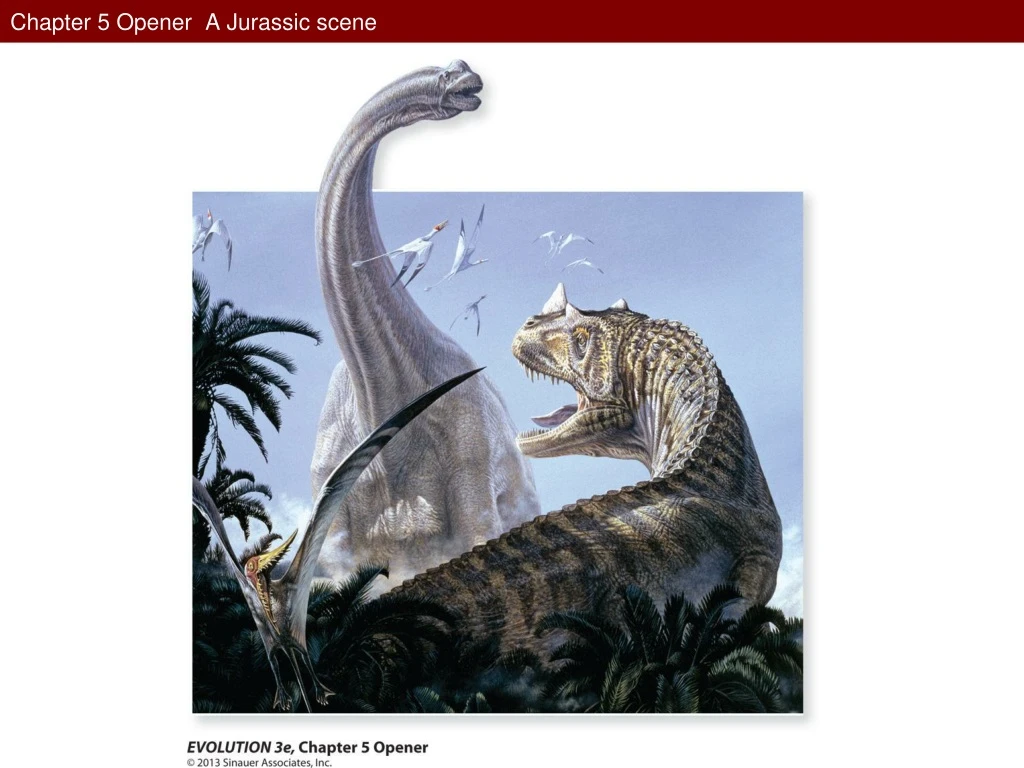
Explore the major events in Earth's early history and the evolution of life through stunning visuals and informative figures. From ancient stromatolites to the rise of mammals, this chapter provides a comprehensive overview of the diverse organisms that have inhabited our planet.

E N D
Figure 5.1 The approximate timing of some of the events in the early history of Earth and life
Figure 5.2 The sequence and structure of the catalytic RNA, a ligase
Table 5.1 Six major transitions in the history of evolution leading to higher-level formation, or groups
Figure 5.3 (A) Stromatolites formed by living cyanobacteria in Shark Bay, Australia. (B) A 3 billion-year-old stromatolite from Western Australia has the same structure as modern stromatolites
Figure 5.9 Two animal groups that first appeared during the Cambrian explosion
Figure 5.11 (A) A choanoflagellate. (B) A sponge, with a close-up showing choanocytes
Figure 5.12 An estimate of relationships among some animal phyla, based on the sequences of multiple genes
Figure 5.15 The phylogeny and Paleozoic fossil record of major groups of terrestrial plants and their closest relatives among the green algae (Chlorophyta)
Figure 5.16 Paleozoic vascular plants, portrayed at different scales
Figure 5.16 Paleozoic vascular plants, portrayed at different scales
Figure 5.17 The distribution of land masses at several points in geological time
Figure 5.18 Features of marine predators and prey that escalated during and after the “Mesozoic marine revolution”
Figure 5.21 Phylogenetic relationships and temporal duration (thick bars) of major groups of amniote vertebrates
Figure 5.24 Multituberculate mammals resembled rodents, but had blade-shaped premolar teeth
Figure 5.24 Multituberculate mammals resembled rodents, but had blade-shaped premolar teeth (Part 1)
Figure 5.24 Multituberculate mammals resembled rodents, but had blade-shaped premolar teeth (Part 2)
Figure 5.25 A phylogeny of living groups of mammals, based on DNA sequence data
Figure 5.26 The giant ground sloth Megatherium was a Pleistocene representative of the Xenarthra
Figure 5.27 Proboscidea, the order of elephants, has only two living genera, but was once very diverse
Figure 5.28 Pleistocene glaciers lowered sea level by at least 100 meters, so that many terrestrial regions that are now separated by oceanic barriers were connected
Figure 5.28 Pleistocene glaciers lowered sea level by at least 100 meters, so that many terrestrial regions that are now separated by oceanic barriers were connected
Figure 5.28 Pleistocene glaciers lowered sea level by at least 100 meters, so that many terrestrial regions that are now separated by oceanic barriers were connected (Part 1)
Figure 5.28 Pleistocene glaciers lowered sea level by at least 100 meters, so that many terrestrial regions that are now separated by oceanic barriers were connected (Part 2)
Figure 5.29 Different rates of northward spread of four North American tree species from refugia after the most recent glacial episode
Figure 5.29 Different rates of northward spread of four North American tree species from refugia after the most recent glacial episode
Figure 5.30 A comparison of the current possible mass extinction with the five major mass extinctions of the past
Figure 5.30 A comparison of the current possible mass extinction with the five major mass extinctions of the past