Download
1 / 12
120 likes | 354 Views
K eng Lei May 05, 2007 C handra A strophysics I nstitute. Super Massive Black Hole. Outline. Super-Massive Black Hole (SMBH) Sagittarius A* (Sag A) Model of A Black Hole Why does Sag A* “Burst” Possible Cause of why Sag A* gets brighter. Introduction and Background. Question:

E N D
Keng Lei May 05, 2007 Chandra Astrophysics Institute Super Massive Black Hole
Outline • Super-Massive Black Hole (SMBH) • Sagittarius A* (Sag A) • Model of A Black Hole • Why does Sag A* “Burst” • Possible Cause of why Sag A* gets brighter
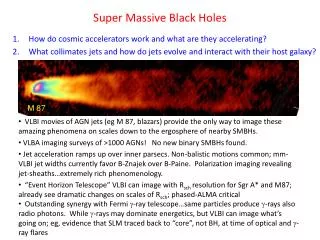
Introduction and Background • Question: • What is a SMBH? • How do we detect it? • Prior Knowledge: • Super-Massive Black Hole – BH with a mass of a million or more Suns located in the center of galaxy. • A Black Hole is an object in space that has a very strong gravitational force, and traps in light as well as other matter. • Gravitational Force – force that exist between matter and the intensity of the force depends on the mass of the matter and the distance between them. • Accretion Disk - A disk formed with matters around the black hole. • About Sag A* • 2.6 million solar masses • Brighter and dimmer from time to time
Black Hole Model How is the spectrum of Sag A* different?
Data/Methods Data Observation ID retrieved from Chandra X-Ray Telescope 3392 (Fred Baganoff) Program used DS9 Program Graphs Generated using DS9 Light Curve Energy Spectrum
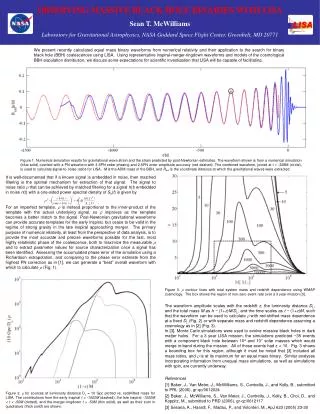
Light Curve Below: OBS ID 3392 graph of time vs photon. Peaks, outlined in red, are the time when the Black Hole is giving off more photons. Yellow line indicates the average photon giving off by the Black Hole.
Spectrum During Burst Above: OBS ID 3392 (During Burst), Spectrum of Sag A during “Bursts”. The blue line shows the general shape of the data points (crosses on the graph) excluding the data point (possible outlier) at 4 keV and the red line indicates the shape of all data points.
Spectrum During Non-Burst Above: (Not During Burst) Spectrum of Sag A with Background taken out. The blue line shows the general shape of all the data points.
Difference in Spectrum Spectrum (During the Burst) Spectrum (Non-Burst)
Discussion / Analysis • Because Burst happens • irregularly…. • We assume… • BH pulls in “BIG chunk of matters” ( from the nearby planet or stars, etc ) into the accretion disk. • The huge amount of matters then increases the friction in the accretion disk. • boost in friction causes large amount of energy to be released in forms of X-Rays.
Conclusions • Using DS 9 • Looked at Obs ID 3392 of Sag A* • Selected the durations of interest (Burst and Non-Burst) • Use those duration to create Energy Spectrum • Compared those Energy Spectrums • Found there’s a spike • Plausible Theory • Friction increases due to huge amount of matters being pulled into the accretion disk. • This intense friction will then cause the accretion disk to release a “Burst” of energy in X-rays
Acknowledgments Ds9 Founders CAI Members CAI Mentors Mark Hartman Fred Baganoff Irene Porro Audiences Like You!