Download
1 / 18
180 likes | 185 Views
This activity explores the concept of randomness using iPod shuffle feature as a simulation. Students analyze playlists and generate random playlists to understand the nature of randomness.

E N D
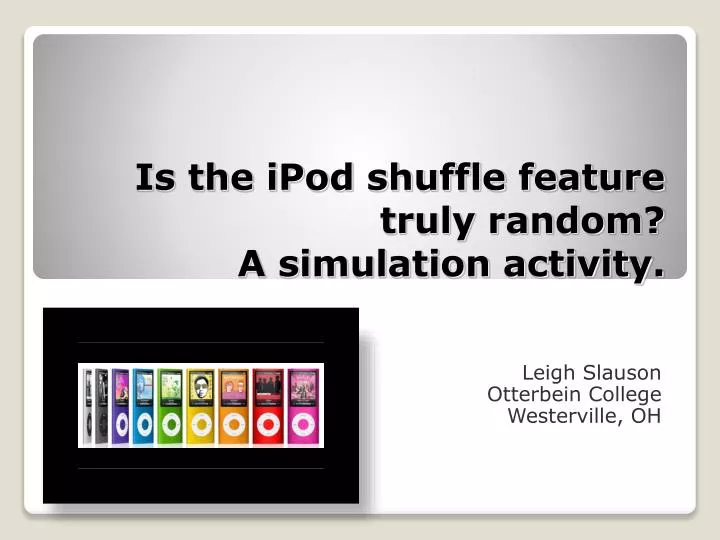
Is the iPod shuffle feature truly random? A simulation activity. Leigh Slauson Otterbein College Westerville, OH
The idea of randomness is fuzzy to most students and very often misunderstood: to most students randomness is equivalent to an even distribution. • In teaching sampling techniques, we often state that a simple random sample is the best way to draw a sample without drawing much attention to what makes a sample random.
Other activities that address the concept of randomness Random Behavior Section in Activity Based Statistics by Scheaffer, Gnanadesikan, Watkins, and Witmer
GAISE recommendations (ASA) • Use real data • “Using real data sets of interest to students is also a good way to engage them in thinking about the data and relevant statistical concepts. There are many types of real data including archival data, classroom-generated data, and simulated data.” • Foster active learning in the classroom • “Active learning allows students to discover, construct, and understand important statistical ideas and to model statistical thinking. Activities have an added benefit in that they often engage students in learning and make the learning process fun.” • Use technology for developing conceptual understanding and analyzing data • “Perform simulations to illustrate abstract concepts”
Background of this activity • Article by Steven Levy in Newsweek in 2005 • “From the day I loaded up my first Pod, it was as if the little devil liked to play favorites. It had a particular fondness for Steely Dan, whose songs always seemed to pop up two or three times in the first hour of play” • Case Study in Mind on Statistics, 3rd Edition, Utts and Heckard
Learning Goals: iPod activity • To helps students have a better understanding of the nature of randomness and to recognize what randomness looks like in reality. • To demonstrate the value of simulations in modeling complex probability questions.
Classroom context • Small liberal arts school • Introductory Statistics Course • College algebra prerequisite • Class size about 30 students • No computer access, but students are required to purchase a TI-83/84 calculator • Variety of majors (math, nursing, athletic training, etc) • Usually do this activity when the textbook gets to sampling plans, around week 7 of a 10 week quarter
Start the activity with a discussion of what does it mean to be “random”? • Have they had the experience of hearing songs by the same artist either back to back or with in a short time frame? • Share the Steven Levy article. • Have students predict how likely it is to get repeated artists in a playlist of 15 randomly selected songs (out of nearly 1000 songs)
Hand out a copy of my personal iPod Playlist I created mine by simply copying all my songs out of iTunes and pasting them into an Excel file. I then assigned each song a number.
Random Number Table • Have students (works best in teams of two) generate the random list of numbers by reading 3 digits at a time from a provided table and match them to the numbered song in the playlist • Show of hands of how many students had repeated artists….usually about 20 – 30% of students will raise their hands and 1 or 2 will have back to back songs • Then show them with the results of 1000 randomly selected playlists of n = 15 songs
Math -> PRB ->randInt Drawbacks: draws with replacement issues with new calculators set to the same starting random seed. Graphing Calculator
Computer simulations • Done this with Minitab – “sample from columns” • Fathom – instructions will be posted in a separate document on CAUSEweb.org • Working on an applet
Some Related Assessment Questions • from ARTIST database • Explain the law of large numbers and why the law of large numbers keeps gambling casinos in business. • from Activity Based Statistics • A book review in the Los Angeles Times about discrimination against upper-class African-Americans contains the following example: A Harvard law student says her professor tended to ignore the raised hands of the black students in class – and then, suddenly, he would call on several black students in a row: “As if, ” she explains, “the professor had suddenly realized that he was neglecting an important segment of the student body and had resolved to make amends.” Discuss this quotation in light of what you have learned from this activity
References/Websites • JSE Article about Activity Based Statistics • http://www.amstat.org/publications/jse/v5n2/gnanadesikan.html • Steven Levy Newsweek article • http://www.newsweek.com/id/36583