Download
1 / 21
210 likes | 359 Views
Highway Project Scoring Overview. Insert Table of Eligibility. Highway Scoring – Eligible Quantitative Criteria. HIGHWAY Scoring. All projects scored on 0-100 point scale For projects on new location, existing data comes from a “parallel route”

E N D
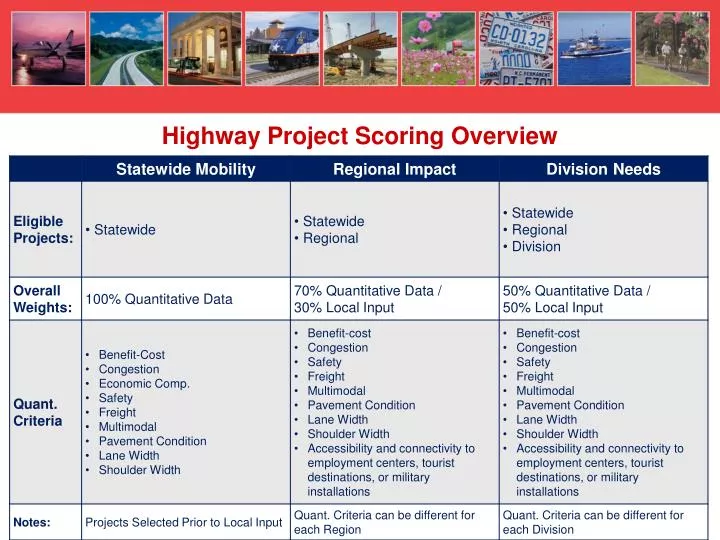
Highway Project Scoring Overview • Insert Table of Eligibility
HIGHWAY Scoring • All projects scored on 0-100 point scale • For projects on new location, existing data comes from a “parallel route” • Parallel Route defined as the roadway(s) motorists currently use to travel between the beginning and end of the project • All quantitative scores will be calculated automatically by application (SPOT On!ine) – user will be able to see preliminary scores shortly after project entry
Example Projects (Completed or Under Construction) 4 Note: Values shown for scoring on subsequent slides are based on 2010 data
HIGHWAY – Congestion Purpose – measure existing level of mobility along roadways by indicating congested locations and bottlenecks ((Existing Vol. / Capacity Ratio x 100) x 60%) + ((Existing Vol. / 1,000) x 40%) Note: The use of Travel Time Index, which is a comparison of actual congested speeds from GPS devices to ideal travel speed, is continuing to be investigated for use in P3.0. Based on input from NCDOT’s traffic engineers, this measure may replace the use of Volume/Capacity ratio in the above equation.
HIGHWAY – [Travel Time] Benefit-Cost • Purpose – measure the expected travel time savings benefits of the project over a 30 year period against the estimated project cost to NCDOT • Travel Time Savings over 30 years in $ / Project Cost to NCDOT • Travel Time Savings calculated using comparison if project was implemented today then multiplied by 30 yrs • Project Cost consists of Construction, Right-of-Way, and Utilities costs • Cost can be lowered if other funds are committed to project by locals
Example Projects – [Travel Time] Benefit-Cost Score *Full benefits of the project are not realized until entire new location roadway is complete. Travel Time Savings and Cost values are based on the entire project. 8
HIGHWAY – Safety • Purpose – measure existing safety conditions along/at the project • Segments (Crash Density x 33%) + (Severity Index x 33%) + • (Critical Crash Rate x 33%) • Intersections (Crash Frequency x 50%) + (Severity Index x 50%) • All data provided by Mobility & Safety Division (3 year moving average) • Higher scores indicate poorer conditions
HIGHWAY – Economic Competitiveness • Purpose – measure the economic benefits the transportation project is expected to provide in economic activity (GDP) and jobs over 30 yrs • Score based on Output from (Economic Impact Model) • Primary inputs are Travel Time Savings, Location, and Freight Traffic • Output is # of long-term jobs created (50%) + Value added in $ (50%) based on % change in NCDOT Division Economy • Includes wages increased, increased productivity • Accounts for current economic conditions (includes use of labor statistics) • Results based on 30 year forecast using Moody’s Analytics data • Does NOT include contingent (prospective) development • Criteria is not intended to evaluate projects for recruiting purposes
HIGHWAY – Accessibility / Connectivity Purpose – measure how to improve connections between rural areas and employment centers, tourist destinations, or military installations (connecting people and places) 3 options proposed: Accessibility / Connectivity Index with rural areas defined as municipalities with population between 2,500 and 20,000 people Accessibility / Connectivity Index with rural areas defined as municipalities with population between 1,500and 20,000 people (new) Evaluation of projects 20 minutes outside of employment centers (new)
HIGHWAY – Accessibility / Connectivity – con’t • Option 1 – Accessibility / Connectivity Index with rural areas defined as municipalities with population between 2,500 and 20,000 people • Score based on Accessibility / Connectivity Index Map • Activity Center and Census Block Groups with 5,000+ Jobs • Activity Centers include cities over 20,000 people, military bases, ports, UNC campuses, trauma centers, top tourist destinations • Rural Area (Rural Population Center) = Municipality with population between 2,500 and 20,000 • Map illustrates overlap of drive times from Activity Centers/Block Groups and Rural Population Centers
Local Input Points • Use in Regional Impact and Division Needs categories only • Points to allocate to projects across all modes as an MPO/RPO TAC Member and communication with Division Engineer • # of Points = 1000 points + additional points based on population • Separate Allocation of Points for Regional Impact Category and Division Needs Category • Point allocation is the same for each • 100 point cap for any one project; points can also be donated across Regions/Divisions 20
Normalization – Workgroup Discussion • Definition – Methodology for comparing quantitative scores across all modes together • Challenges: • Different criteria and weights used for evaluating projects in each mode • No easy solution conducted review of methodologies across country • No other state has successfully implemented such a comparison • Evaluated several potential options including: • Qualitative value judgment • Weighted benefit/cost • Statistical analysis • vs • vs • vs • vs • vs 21
Prioritization 3.0 Schedule 2014 2015 2013 May June Dec Jan Feb Mar Apr May June July Aug Sept Oct Nov Dec Jan Feb Mar Apr BOT Input through MPO/RPO TACs and Division Engineers Score Exist. Projects Submit New Projects All Modes BOT Input through MPO/RPO TACs and Division Engineers DOT Calculates Quant. Scores, & Programs STW Mob. Projects MPOs/RPOs & Divisions Assign Local Input Points All Modes BOT Input BOT Input DOT Finalizes Scores for All Modes DOT Develops Draft STIP Draft STIP Public Comment Period Air Quality Conformity Analysis Final STIP Adopted by July 1, 2015 25 Year Infrastructure Planning Process Final STIP must be Approved by October 1, 2015 by FHWA to Continue Receiving Federal Dollars July 2, 2013