Download
1 / 32
320 likes | 431 Views
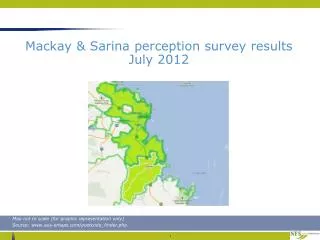
Mackay & Sarina p erception survey results July 2012. Map not to scale (for graphic representation only) Source: www.aus-emaps.com/postcode_finder.php. Summary.

E N D
Mackay & Sarina perception survey results July 2012 Map not to scale (for graphic representation only) Source: www.aus-emaps.com/postcode_finder.php
Summary • A Computer Assisted Telephone Survey (CATI) was undertaken with 420 residents of Mackay and Sarina post code areas in July 2012. • The perception survey found: • 76% of respondents (n=321) were residents of Mackay, 14% (n=60) were residents of Sarina and 9% (n=39) were residents of surrounding localities. • All respondents were aware of the proposed Project and 34% were interested in more information. • When asked whether the Project was a positive development for the region, 71% of respondents perceived that it was. Key perceived benefits were employment opportunities and an improved economy. • When asked whether the Project would have any negative impacts, 75% of respondents thought that there would be. The main concerns were regarding coal dust, impacts on marine life and impacts on the Great Barrier Reef.
Key findings Aggregated survey results
Demographics - gender A good spread of both male and female respondents were interviewed
Demographics - locality Base: n=420 respondents
Respondents interested in more information All respondents have heard of the Project. *Please note the small base for Other
Respondents interested in more information by location Base: n=420 respondents *Please note the small base for Other
Respondents interested in more information by gender Male respondents are more interested in additional information than females. Please note statistically significant difference at 95% confidence
Do you think the proposed Project is positive for the region? *Please note the small base for Other
Do you think the proposed Project is positive for the region? *Please note the small base for Other
Do you think the proposed Project is positive for the region? More male respondents think that the proposed Project is positive for the region than females More female respondents are unsure if the Project is positive for the region Please note statistical significance
What opportunities could the Project bring? *Please note small base
Do you think there will be any negative impacts from the proposed Project? *Please note small base for Other
Perception of negative impacts by location *Please note small base for Other
Perception of negative impacts- extensive 41% of male residents are concerned about coal dust affecting air quality compared with 28% females. This is statistically significant. Includes responses with mentions of 5% or more. Excludes uncoded responses.
Perception of negative impacts- extensive Includes responses with mentions of 5% or more. Excludes uncodedresponses.
Perception of negative impacts- collated *Please note small base number
Perception of negative impacts- extensive Includes responses with mentions of 5% or more. Excludes uncoded responses. *Please note small base
Perception of negative impacts- extensive Includes responses with mentions of 5% or more. Excludes uncoded responses. *Please note small base number
Perception of negative impacts- collated *Please note small base
Ranked negative impacts Base: (n=316) Q4 Will have negative impacts
Suggestions to improve Project benefits for the region Responses have been collated
Suggestions to improve Project benefits for the region Responses have been collated
Suggestions to improve Project benefits for the region *Please note small base
Suggestions to improve Project benefits for the region *Please note small base