Download

1 / 38
380 likes | 544 Views
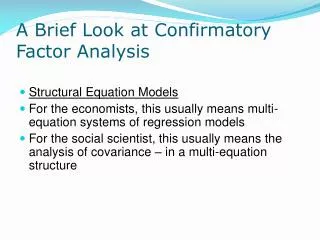
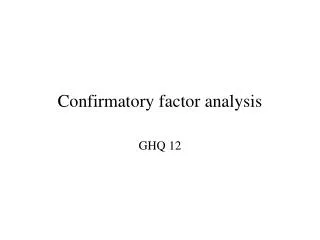
Confirmatory factor analysis. Hans Baumgartner Penn State University. x 1. x 2. x 3. x 4. x 5. x 6. x 7. x 8. What’s the structure underlying 28 distinct covariances between 8 observed variables?. 1. 1. d. d. d. d. d. d. d. d. q 88. q 22. q 33. q 55. q 11. q 66.

E N D
Confirmatory factor analysis Hans Baumgartner Penn State University
x1 x2 x3 x4 x5 x6 x7 x8 What’s the structure underlying 28 distinct covariances between 8 observed variables?
1 1 d d d d d d d d q88 q22 q33 q55 q11 q66 q77 q44 The exploratory factor model . . . . . . . . . . . . . . . x1 xq x1 x2 x3 x4 x5 x6 x7 x8 d1 d2 d3 d4 d5 d6 d7 d8
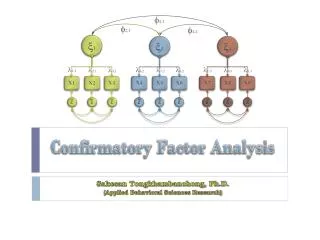
d d d d d d d d q22 q33 q44 q11 q77 q88 q55 q66 The confirmatory factor model j21 1 1 x1 x2 l11 l31 l41 l62 l72 l82 l21 l52 x1 x2 x3 x4 x5 x6 x7 x8 d1 d2 d3 d4 d5 d6 d7 d8
d d d d d d d d q11 q44 q88 q77 q55 q33 q22 q66 j21 1 1 x1 x2 l11 l31 l41 l62 l72 l82 l21 l52 x1 x2 x3 x4 x5 x6 x7 x8 d1 d2 d3 d4 d5 d6 d7 d8
d d d d d d d d q44 q11 q88 q77 q55 q33 q22 q66 j21 1 1 x1 x2 l11 l31 l41 l62 l72 l82 l21 l52 x1 x2 x3 x4 x5 x6 x7 x8 d1 d2 d3 d4 d5 d6 d7 d8
d d d d d d d d q11 q44 q88 q77 q55 q33 q22 q66 j21 1 1 x1 x2 l11 l31 l41 l62 l72 l82 l21 l52 x1 x2 x3 x4 x5 x6 x7 x8 d1 d2 d3 d4 d5 d6 d7 d8
d d d d d d d d q11 q44 q88 q77 q55 q33 q22 q66 j21 1 1 x1 x2 l11 l31 l41 l62 l72 l82 l21 l52 x1 x2 x3 x4 x5 x6 x7 x8 d1 d2 d3 d4 d5 d6 d7 d8
d d d d d d d d q11 q44 q88 q77 q55 q33 q22 q66 j21 1 1 x1 x2 l11 l31 l41 l62 l72 l82 l21 l52 x1 x2 x3 x4 x5 x6 x7 x8 d1 d2 d3 d4 d5 d6 d7 d8
d d d d d d d d q11 q44 q88 q77 q55 q33 q22 q66 j21 1 1 x1 x2 l11 l31 l41 l62 l72 l82 l21 l52 x1 x2 x3 x4 x5 x6 x7 x8 d1 d2 d3 d4 d5 d6 d7 d8
d d d d d d d d q22 q33 q44 q55 q77 q88 q11 q66 The congenericfactor model j21 1 1 x1 x2 l11 l31 l41 l62 l72 l82 l21 l52 x1 x2 x3 x4 x5 x6 x7 x8 d1 d2 d3 d4 d5 d6 d7 d8
d d d d d d d d q11 q44 q88 q77 q55 q33 q22 q66 j21 1 1 x1 x2 l1 l1 l62 l72 l82 l1 l52 l1 x1 x2 x3 x4 x5 x6 x7 x8 d1 d2 d3 d4 d5 d6 d7 d8
d d d d d d d d q55 q77 q22 q33 q11 q88 q66 q44 j21 1 1 x1 x2 l51 l11 l31 l41 l62 l72 l82 l21 l52 x1 x2 x3 x4 x5 x6 x7 x8 d1 d2 d3 d4 d5 d6 d7 d8
d d d d d d d d q11 q44 q88 q77 q55 q33 q22 q66 21= 0 or 1 1 1 x1 x2 l11 l31 l41 l62 l72 l82 l21 l52 x1 x2 x3 x4 x5 x6 x7 x8 d1 d2 d3 d4 d5 d6 d7 d8
d d d d q88 q77 q66 q55 j21 1 1 x1 x2 l1 l1 l62 l72 l82 l1 l52 l1 x1 x2 x3 x4 x5 x6 x7 x8 d1 d1 d1 d1 d5 d6 d7 d8 q11 q11 q11 q11
d d d d d d d d q44 q88 q77 q66 q33 q51 q22 q11 q55 j21 1 1 x1 x2 l11 l31 l41 l62 l72 l82 l21 l52 x1 x2 x3 x4 x5 x6 x7 x8 d1 d2 d3 d4 d5 d6 d7 d8
A MTMM model (Appendix B) T1 T3 T2 T1M1 T1M2 T1M3 T2M1 T2M2 T2M3 T3M1 T3M2 T3M3 M1 M2 M3
Model identification Setting the scale of the latent variables A necessary condition for identification Two- and three-indicator rules Identification from first principles Empirical identification tests
j21 x1 x2 l11 l21 l32 l42 x1 x2 x3 x4 d1 d2 d3 d4 Identification of a simple model (Appendix C)
Model estimation • Discrepancy functions: • Unweighted least squares (ULS) • Maximum likelihood (ML) • Generalized least squares (GLS) • Other methods • Estimation problems: • Nonconvergence • Improper solutions
Model testing • Global fit measures: • χ2 goodness of fit test • Alternative fit indices • Local fit measures: • Parameter estimates • Reliability • Discriminant validity • Model modification: • Modification indices and EPC’s • Residuals
Reliability for congeneric measures • individual-item reliability (squared correlation between a construct ξj and one of its indicators xi): ρii = λij2var(ξj)/[ λij2 var(ξj) + θii] composite reliability (squared correlation between a construct and an unweighted composite of its indicators x = x1 + x2 + ... + xK): ρc = (Σλij)2 var(ξj)/[ (Σλij)2 var(ξj) + Σθii] average variance extracted (proportion of the total variance in all indicators of a construct accounted for by the construct; see Fornell and Larcker 1981): ρave= (Σλij2)var(ξj)/[ (Σλij2) var(ξj) + Σθii]
SIMPLIS specification Title Confirmatory factor model (attitude toward using coupons measured at two points in time) Observed Variables id aa1t1 aa2t1 aa3t1 aa4t1 aa1t2 aa2t2 aa3t2 aa4t2 Raw Data from File=d:\m554\eden\cfa.dat Latent Variables AAT1 AAT2 Sample Size 250 Relationships aa1t1 aa2t1 aa3t1 aa4t1 = AAT1 aa1t2 aa2t2 aa3t2 aa4t2 = AAT2 Set the Variance of AAT1 AAT2 to 1 Options sc rs mi wp End of Problem
Goodness of Fit Statistics: Degrees of Freedom = 19 Minimum Fit Function Chi-Square = 72.98 (P = 0.00) Normal Theory Weighted Least Squares Chi-Square = 67.97 (P = 0.00) Estimated Non-centrality Parameter (NCP) = 48.97 90 Percent Confidence Interval for NCP = (27.51 ; 78.01) Minimum Fit Function Value = 0.29 Population Discrepancy Function Value (F0) = 0.20 90 Percent Confidence Interval for F0 = (0.11 ; 0.31) Root Mean Square Error of Approximation (RMSEA) = 0.10 90 Percent Confidence Interval for RMSEA = (0.076 ; 0.13) P-Value for Test of Close Fit (RMSEA < 0.05) = 0.00073 Expected Cross-Validation Index (ECVI) = 0.41 90 Percent Confidence Interval for ECVI = (0.32 ; 0.53) ECVI for Saturated Model = 0.29 ECVI for Independence Model = 12.05 Chi-Square for Independence Model with 28 Degrees of Freedom = 2983.93 Independence AIC = 2999.93 Model AIC = 101.97 Saturated AIC = 72.00 Independence CAIC = 3036.10 Model CAIC = 178.83 Saturated CAIC = 234.77 Normed Fit Index (NFI) = 0.98 Non-Normed Fit Index (NNFI) = 0.97 Parsimony Normed Fit Index (PNFI) = 0.66 Comparative Fit Index (CFI) = 0.98 Incremental Fit Index (IFI) = 0.98 Relative Fit Index (RFI) = 0.96 Critical N (CN) = 124.47 Root Mean Square Residual (RMR) = 0.055 Standardized RMR = 0.032 Goodness of Fit Index (GFI) = 0.94 Adjusted Goodness of Fit Index (AGFI) = 0.88 Parsimony Goodness of Fit Index (PGFI) = 0.49
Measurement Equations: aa1t1 = 1.10*AAT1, Errorvar.= 0.65 , R2 = 0.65 (0.073) (0.070) 15.02 9.23 aa2t1 = 1.10*AAT1, Errorvar.= 0.50 , R2 = 0.71 (0.069) (0.058) 16.06 8.60 aa3t1 = 0.94*AAT1, Errorvar.= 0.74 , R2 = 0.54 (0.071) (0.074) 13.18 9.94 aa4t1 = 1.21*AAT1, Errorvar.= 0.56 , R2 = 0.73 (0.074) (0.066) 16.33 8.40 aa1t2 = 1.20*AAT2, Errorvar.= 0.55 , R2 = 0.72 (0.073) (0.061) 16.43 8.92 aa2t2 = 1.16*AAT2, Errorvar.= 0.41 , R2 = 0.77 (0.068) (0.049) 17.23 8.33 aa3t2 = 0.99*AAT2, Errorvar.= 0.55 , R2 = 0.64 (0.066) (0.056) 14.95 9.65 aa4t2 = 1.23*AAT2, Errorvar.= 0.49 , R2 = 0.76 (0.072) (0.057) 17.04 8.49
Correlation Matrix of Independent Variables (AVE)½[.81] [.85] AAT1 AAT2 -------- -------- [.81] AAT1 1.00 [.85] AAT2 0.90 1.00 (0.02) 45.14
Standardized Residuals aa1t1 aa2t1 aa3t1 aa4t1 aa1t2 aa2t2 aa3t2 aa4t2 -------- -------- -------- -------- -------- -------- -------- -------- aa1t1 - - aa2t1 -0.57 - - aa3t1 0.53 -0.52 - - aa4t1 -0.20 2.07 -1.58 - - aa1t2 3.84 2.17 0.00 -0.90 - - aa2t2 -1.13 0.16 -0.14 -1.16 -0.49 - - aa3t2 -1.26 -1.89 4.90 0.81 -1.63 0.26 - - aa4t2 -0.74 -2.71 -0.10 0.41 -0.45 1.42 0.71 - -
Modification Indices and Expected Change Modification Indices for LAMBDA-X AAT1 AAT2 -------- -------- aa1t1 - - 0.11 aa2t1 - - 1.19 aa3t1 - - 2.48 aa4t1 - - 0.30 aa1t2 5.94 - - aa2t2 1.46 - - aa3t2 0.37 - - aa4t2 2.78 - -
Modification Indices for THETA-DELTA aa1t1 aa2t1 aa3t1 aa4t1 aa1t2 aa2t2 aa3t2 aa4t2 -------- -------- -------- -------- -------- -------- -------- -------- aa1t1 - - aa2t1 0.32 - - aa3t1 0.28 0.27 - - aa4t1 0.04 4.28 2.49 - - aa1t2 16.26 5.45 2.37 4.97 - - aa2t2 1.66 1.83 0.57 0.65 0.24 - - aa3t2 4.06 6.09 27.88 0.95 2.67 0.07 - - aa4t2 0.30 6.31 0.27 2.77 0.20 2.02 0.51 - -
Title Confirmatory factor model (attitude toward using coupons measured at two points in time) Observed Variables id aa1t1 aa2t1 aa3t1 aa4t1 aa1t2 aa2t2 aa3t2 aa4t2 Raw Data from File=d:\m554\eden2\cfa.dat Latent Variables AAT1 AAT2 Sample Size 250 Relationships aa1t1 aa2t1 aa3t1 aa4t1 = AAT1 aa1t2 aa2t2 aa3t2 aa4t2 = AAT2 Set the Variance of AAT1 AAT2 to 1 Set the Error Covariance of aa1t1 and aa1t2 free Set the Error Covariance of aa2t1 and aa2t2 free Set the Error Covariance of aa3t1 and aa3t2 free Set the Error Covariance of aa4t1 and aa4t2 free Options sc rs mi wp Path Diagram End of Problem
Goodness of Fit Statistics: Degrees of Freedom = 15 Minimum Fit Function Chi-Square = 26.76 (P = 0.031) Normal Theory Weighted Least Squares Chi-Square = 26.28 (P = 0.035) Estimated Non-centrality Parameter (NCP) = 11.28 90 Percent Confidence Interval for NCP = (0.78 ; 29.60) Minimum Fit Function Value = 0.11 Population Discrepancy Function Value (F0) = 0.045 90 Percent Confidence Interval for F0 = (0.0031 ; 0.12) Root Mean Square Error of Approximation (RMSEA) = 0.055 90 Percent Confidence Interval for RMSEA = (0.014 ; 0.089) P-Value for Test of Close Fit (RMSEA < 0.05) = 0.37 Expected Cross-Validation Index (ECVI) = 0.27 90 Percent Confidence Interval for ECVI = (0.23 ; 0.35) ECVI for Saturated Model = 0.29 ECVI for Independence Model = 12.05 Chi-Square for Independence Model with 28 Degrees of Freedom = 2983.93 Independence AIC = 2999.93 Model AIC = 68.28 Saturated AIC = 72.00 Independence CAIC = 3036.10 Model CAIC = 163.23 Saturated CAIC = 234.77 Normed Fit Index (NFI) = 0.99 Non-Normed Fit Index (NNFI) = 0.99 Parsimony Normed Fit Index (PNFI) = 0.53 Comparative Fit Index (CFI) = 1.00 Incremental Fit Index (IFI) = 1.00 Relative Fit Index (RFI) = 0.98 Critical N (CN) = 285.55 Root Mean Square Residual (RMR) = 0.031 Standardized RMR = 0.017 Goodness of Fit Index (GFI) = 0.97 Adjusted Goodness of Fit Index (AGFI) = 0.94 Parsimony Goodness of Fit Index (PGFI) = 0.41
Completely Standardized Solution LAMBDA-X AAT1 AAT2 -------- -------- aa1t1 0.80 - - aa2t1 0.85 - - aa3t1 0.73 - - aa4t1 0.86 - - aa1t2 - - 0.85 aa2t2 - - 0.88 aa3t2 - - 0.79 aa4t2 - - 0.87 PHI AAT1 AAT2 -------- -------- AAT1 1.00 AAT2 0.89 1.00 THETA-DELTA aa1t1 aa2t1 aa3t1 aa4t1 aa1t2 aa2t2 aa3t2 aa4t2 -------- -------- -------- -------- -------- -------- -------- -------- aa1t1 0.36 aa2t1 - - 0.28 aa3t1 - - - - 0.47 aa4t1 - - - - - - 0.27 aa1t2 0.09 [.28] - - - - - - 0.29 aa2t2 - - 0.02 - - - - - - 0.22 aa3t2 - - - - 0.15 [.36] - - - - - - 0.37 aa4t2 - - - - - - 0.02 - - - - - - 0.24