Download
1 / 46
460 likes | 462 Views
This study examines the resolved X-ray emission line profiles of O stars using quantitative analysis and modeling techniques. The effects of wind clumping and porosity on the mass-loss rates and opacity of the stellar winds are investigated. The results provide valuable insights into the physical properties of O stars.

E N D
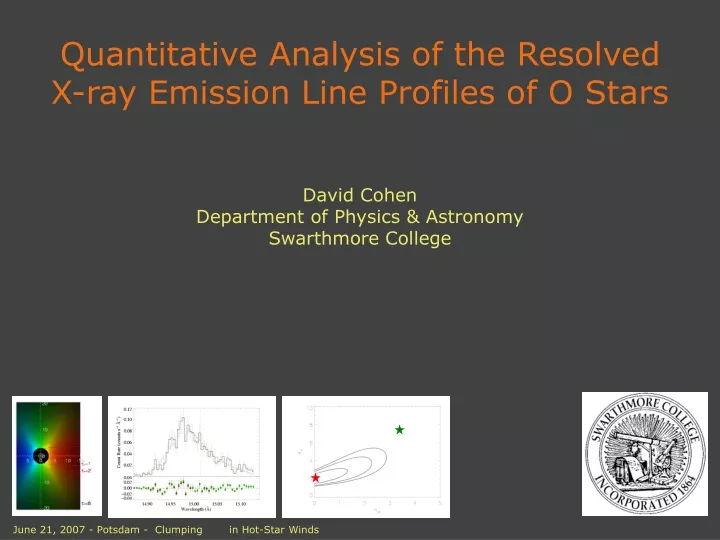
Quantitative Analysis of the Resolved X-ray Emission Line Profiles of O Stars David CohenDepartment of Physics & AstronomySwarthmore College June 21, 2007 - Potsdam - Clumping in Hot-Star Winds
OUTLINE The wind profile model and quantitative model fitting Smooth wind models: constraints on mass-loss rates Models with porosity: the * - h∞trade-off A note on grayness and opacity What porosity lengths are realistic?
t= 1,2,8 The basic smooth wind model: Ro=1.5 key parameters: Ro & t* *=1 j 2 for r/R* > Ro, = 0 otherwise Ro=3 Ro=10
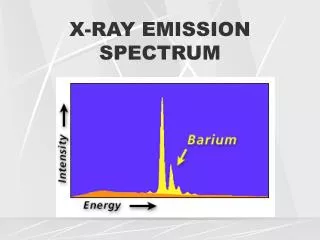
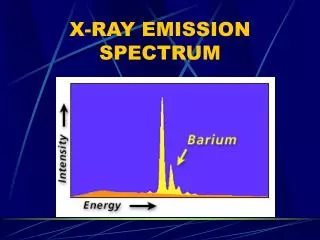
Highest S/N line in the z Pup Chandra spectrum Fe XVII @ 15.014 Å -v∞ +v∞ lo l/Dl 560 total counts Fe+16 – neon-like; dominant stage of iron at T ~ 3 X 10⁶ K in this coronal (collisions up; spontaneous emission down) plasma
Best fit smooth wind model *=2.0Ro=1.5 Fit statistic: “Cash C” - maximum likelihood estimator for Poisson distributed data C = 98.5 for 103 degrees of freedom: P = 19%
Confidence limits can be placed on the fitted model parameters 95% 90% 68% The confidence contours enclose regions where C = C-Cmin exceeds a particular value (C = 2.30 corresponds to 68% for two parameters)
Confidence limits can be placed on the fitted model parameters 95% 90% 68% 1.5 < * < 2.6 and 1.3 < Ro < 1.7
Best-fit smooth-wind model with * = 8 This is the value of * expected from M = 2.4 X 10⁻⁶ Msun/yr
C = 98.5C = 178 The best-fit model, with * = 2, is preferred over the * = 8 model with >99.999% confidence
~ 150 cm2 g-1 @ 15 Å M = 7 X 10⁻⁷ Msun/yr …so, a factor of 4 reduction in mass-loss rate over the literature value of 2.4 X 10⁻⁶
porosity due to optically thick clumpsacts to reduce the effective opacity of the wind h=h’r/R* l’=0.1 The key parameter is the porosity length, h = (L3/l2) = l/f Porosity reduces the effective wind optical depth once h becomes comparable to r/R*
The optical depth integral is modified according to the clumping-induced effective opacity: Line profiles are not significantly affected until the porosity length is comparable to the stellar radius from Owocki & Cohen 2006, ApJ, 648,565
Isotropic porosity h∞=0 h∞=1 h∞=5 h∞=0.5
Anisotropic porosity (1-e-tau)/tau h∞=0 h∞=1 h∞=5 h∞=0.5
Fitting models that include porosity from spherical clumps in a beta-law distribution *=2.0Ro=1.5h∞=0.0 Identical to the smooth wind fit: h∞ = 0 is the preferred value of h∞.
Joint constraints on * and h∞ best-fit model with *=8 95% 68% C=9.4: best-fit model is preferred over *=8 model with > 99% confidence best-fit model
The differences between the models are subtle… *=8; h∞=3.3*=2; h∞=0.0 …but statistically significant
Two models from previous slide, but with perfect resolution *=8; h∞=3.3*=2; h∞=0.0
Joint constraints on * and h∞ h∞ > 2.5 is required if you want to “rescue” the literature mass-loss rate 95% 68% Even a model with h∞=1 only allows for a slightly larger * and, hence, mass-loss rate
For anisotropic porosity: oblate (“pancake”) clumps - based on the fragmented wind model introduced by OFH: c=h/ - the fits are even worse I haven’t made figures yet, but these aniso models fit even less well than the iso porous models, with correspondingly lower values of h∞ allowed. Here too, h∞=0 is the preferred value.
Best-fit anisotropic porosity model with t*=8 – C=138.50; h_inf=2.9, umax=.662
Smooth vs. isoporous vs. anisoporous t*=2 t*=8
Similar fit to another line: Ne X Lya Note that the plot below - because the confidence region is larger - graphically demonstrates the trade-off between optical depth and porosity length model with literature M-dot I have to re-do this fit and remake the figures, using our more recent assessment of the wind opacity* best fit *In case you’re wondering why the M-dot overestimate for zeta Pup seems now to be much more modest, I’d have to say that it’s because of my uncritical adoption of Hillier et al.’s wind opacity/optical depth values.
Data indicate that the effective opacity is gray: all the profiles in a given star’s X-ray spectrum look the same This is explained naturally by a porosity-dominated wind; But, atomic opacity is also quite gray over the relevant wavelength range. OFH2006 Fe XVII @ 15 Å Waldron et al. 1998, ApJS, 118, 217
Wind opacity: bound-free, primarily from partially ionized C, N, O in the ambient wind Each ion has maximum opacity at the photoionization threshold, with ~ 3…until the next edge is reached. OFH2006 show only a single edge, of neutral O. Combined effects of different elements and the shifting of edges due to ionization tend to flatten out the opacity.
Detailed calculations of wind opacity are necessary:factor of ~2 across Chandra range…not obviously detectable with current data Cohen et al. 1996, ApJ, 460, 506 Hillier et al. 1993, A&A, 276, 117
Large porosity lengths are not expected from the line-driven instability. The clumping in 2-D simulations (below) is on quite small scales. Dessart & Owocki 2003, A&A, 406, L1
Line profiles synthesized from the 2-D simulations shown on the previous slide (blue dashed) compared to those from a smooth wind (black solid). The clumping structure from state-of-the art simulations has no effect on the line profiles. Each frame shows profiles calculated assuming *=1,2,5. Courtesy: Luc Dessart
CONCLUSIONS Smooth-wind emission and absorption models provide good fits to the data. Mass-loss rate reductions of a factor of 3 to 5 are required. Models with isotropic porosity provide poorer fits, but cannot yet be definitively ruled out.
CONCLUSIONS, pt. II However, for porosity to eliminate the need for mass-loss rate reduction, porosity lengths >2.5 are required. 2-D numerical simulations of wind structure generate much smaller porosity lengths. Anisotropic porosity (pancakes) provides even worse fits to the data than models with isotropic porosity (spheres). The relative grayness of the effective opacity over the range that includes the strong lines in the Chandra MEG can be understood in terms of realistic, detailed wind opacity models.
t=1,2,8 The basic smooth wind model: Ro=1.5 for r>Ro *=1 key parameters: Ro & t* j 2 for r/R* > Ro, = 0 otherwise Ro=3 Ro=10
z Ori (O9.7 I) – the lines are broad, shifted, and asymmetric 94% 73% An unshifted Gaussian doesn’t fit A shifted Gaussian fits OK A kinematic, smooth wind model with absorption fits better 54% Rejection probabilities are shown on the right of each panel.
Fit results for z Ori summarized Note that the O VII line at 21.6 Å is longward of the O K-shell edge -- evidence for non-gray opacity? t* The wind optical depths are ~4 times lower than those found for z Pup…which is roughly consistent with the differences in stellar and wind parameters between the two stars
Wind opacity for canonical B star abundances. We do expect some wavelength dependence of the cross sections (and thus of the wind optical depth), BUT the lines we fit cover only a modest range of wavelengths. And in the case ofzPup, nitrogen overabundance (not in calculation shown at right) could flatten out the wavelength dependence even more. N K-edge Note: dotted line is interstellar.