Download
1 / 1
10 likes | 103 Views
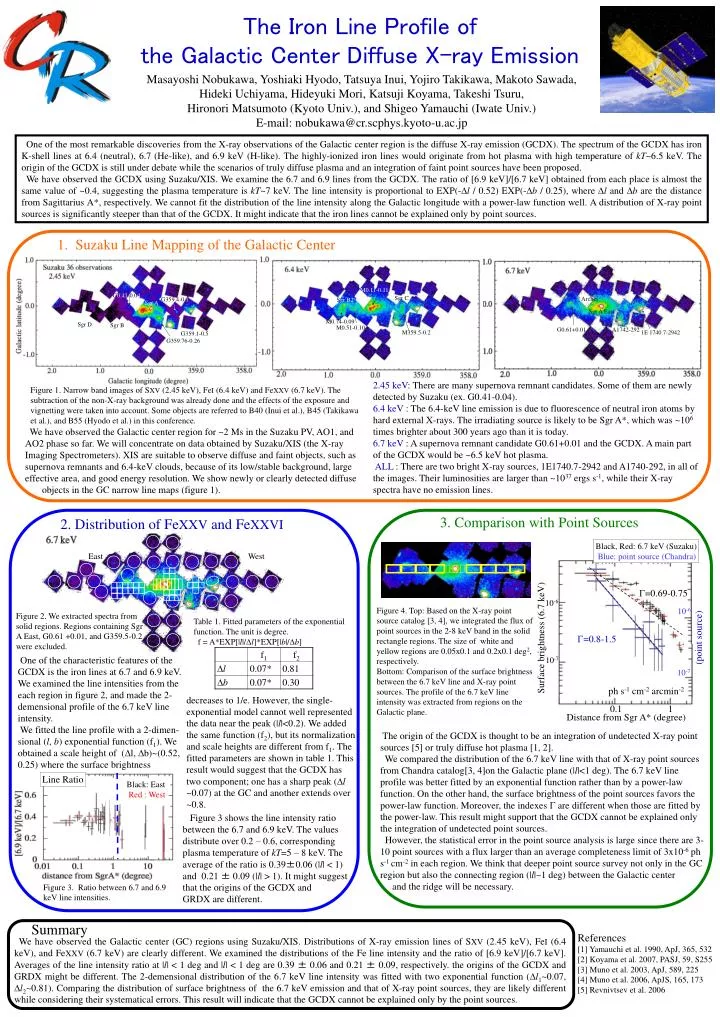
The Iron Line Profile of the Galactic Center Diffuse X-ray Emission. Masayoshi Nobukawa, Yoshiaki Hyodo, Tatsuya Inui, Yojiro Takikawa, Makoto Sawada, Hideki Uchiyama, Hideyuki Mori, Katsuji Koyama, Takeshi Tsuru, Hironori Matsumoto (Kyoto Univ.), and Shigeo Yamauchi (Iwate Univ.)

E N D
The Iron Line Profile of the Galactic Center Diffuse X-ray Emission Masayoshi Nobukawa, Yoshiaki Hyodo, Tatsuya Inui, Yojiro Takikawa, Makoto Sawada, Hideki Uchiyama, Hideyuki Mori, Katsuji Koyama, Takeshi Tsuru, Hironori Matsumoto (Kyoto Univ.), and Shigeo Yamauchi (Iwate Univ.) E-mail: nobukawa@cr.scphys.kyoto-u.ac.jp One of the most remarkable discoveries from the X-ray observations of the Galactic center region is the diffuse X-ray emission (GCDX). The spectrum of the GCDX has iron K-shell lines at 6.4 (neutral), 6.7 (He-like), and 6.9 keV (H-like). The highly-ionized iron lines would originate from hot plasma with high temperature of kT~6.5 keV. The origin of the GCDX is still under debate while the scenarios of truly diffuse plasma and an integration of faint point sources have been proposed. We have observed the GCDX using Suzaku/XIS. We examine the 6.7 and 6.9 lines from the GCDX. The ratio of [6.9 keV]/[6.7 keV] obtained from each place is almost the same value of ~0.4, suggesting the plasma temperature is kT~7 keV. The line intensity is proportional to EXP(-Dl / 0.52) EXP(-Db / 0.25), where Dl and Db are the distance from Sagittarius A*, respectively. We cannot fit the distribution of the line intensity along the Galactic longitude with a power-law function well. A distribution of X-ray point sources is significantly steeper than that of the GCDX. It might indicate that the iron lines cannot be explained only by point sources. 1. Suzaku Line Mapping of the Galactic Center M0.11-0.11 G0.41-0.04 Sgr C Arches G359.4-0.1 Sgr B2 Sgr A Sgr A East M0.74-0.09 Sgr D Sgr B M0.51-0.10 G0.61+0.01 A1742-292 M359.5-0.2 1E 1740.7-2942 G359.1-0.5 G359.76-0.26 2.45 keV: There are many supernova remnant candidates. Some of them are newly detected by Suzaku (ex. G0.41-0.04). 6.4 keV : The 6.4-keV line emission is due to fluorescence of neutral iron atoms by hard external X-rays. The irradiating source is likely to be Sgr A*, which was ~106 times brighter about 300 years ago than it is today. 6.7 keV : A supernova remnant candidate G0.61+0.01 and the GCDX. A main part of the GCDX would be ~6.5 keV hot plasma. ALL : There are two bright X-ray sources, 1E1740.7-2942 and A1740-292, in all of the images. Their luminosities are larger than ~1037 ergs s-1, while their X-ray spectra have no emission lines. Figure 1. Narrow band images of SXV (2.45 keV), FeI (6.4 keV) and FeXXV (6.7 keV). The subtraction of the non-X-ray background was already done and the effects of the exposure and vignetting were taken into account. Some objects are referred to B40 (Inui et al.), B45 (Takikawa et al.), and B55 (Hyodo et al.) in this conference. We have observed the Galactic center region for ~2 Ms in the Suzaku PV, AO1, and AO2 phase so far. We will concentrate on data obtained by Suzaku/XIS (the X-ray Imaging Spectrometers). XIS are suitable to observe diffuse and faint objects, such as supernova remnants and 6.4-keV clouds, because of its low/stable background, large effective area, and good energy resolution. We show newly or clearly detected diffuse objects in the GC narrow line maps (figure 1). 3. Comparison with Point Sources 2. Distribution of FeXXV and FeXXVI Black, Red: 6.7 keV (Suzaku) Blue: point source (Chandra) East West G=0.69-0.75 10-6 Figure 4. Top: Based on the X-ray point source catalog [3, 4], we integrated the flux of point sources in the 2-8 keV band in the solid rectangle regions. The size of white and yellow regions are 0.05x0.1 and 0.2x0.1 deg2, respectively. Bottom: Comparison of the surface brightness between the 6.7 keV line and X-ray point sources. The profile of the 6.7 keV line intensity was extracted from regions on the Galactic plane. 10-6 Figure 2. We extracted spectra from solid regions. Regions containing Sgr A East, G0.61 +0.01, and G359.5-0.2 were excluded. Table 1. Fitted parameters of the exponential function. The unit is degree. f = A*EXP[|l|/Dl]*EXP[|b|/Db] (point source) Surface brightness (6.7 keV) G=0.8-1.5 One of the characteristic features of the GCDX is the iron lines at 6.7 and 6.9 keV. We examined the line intensities from the each region in figure 2, and made the 2-demensional profile of the 6.7 keV line intensity. We fitted the line profile with a 2-dimen-sional (l, b) exponential function (f1). We obtained a scale height of (Dl, Db)~(0.52, 0.25) where the surface brightness 10-7 10-7 ph s-1 cm-2 arcmin-2 decreases to 1/e. However, the single-exponential model cannot well represented the data near the peak (|l|<0.2). We added the same function (f2), but its normalization and scale heights are different from f1. The fitted parameters are shown in table 1. This result would suggest that the GCDX has two component; one has a sharp peak (Dl ~0.07) at the GC and another extends over ~0.8. 0.1 1 Distance from Sgr A* (degree) The origin of the GCDX is thought to be an integration of undetected X-ray point sources [5] or truly diffuse hot plasma [1, 2]. We compared the distribution of the 6.7 keV line with that of X-ray point sources from Chandra catalog[3, 4]on the Galactic plane (|l|<1 deg). The 6.7 keV line profile was better fitted by an exponential function rather than by a power-law function. On the other hand, the surface brightness of the point sources favors the power-law function. Moreover, the indexes G are different when those are fitted by the power-law. This result might support that the GCDX cannot be explained only the integration of undetected point sources. However, the statistical error in the point source analysis is large since there are 3-10 point sources with a flux larger than an average completeness limit of 3x10⁻⁶ ph s-1 cm-2 in each region. We think that deeper point source survey not only in the GC region but also the connecting region (|l|~1 deg) between the Galactic center and the ridge will be necessary. Line Ratio Black: East Red : West Figure 3 shows the line intensity ratio between the 6.7 and 6.9 keV. The values distribute over 0.2 – 0.6, corresponding plasma temperature of kT=5 – 8 keV. The average of the ratio is 0.39±0.06 (|l| < 1) and 0.21 ± 0.09 (|l| > 1). It might suggest that the origins of the GCDX and GRDX are different. Figure 3. Ratio between 6.7 and 6.9 keV line intensities. Summary References [1] Yamauchi et al. 1990, ApJ, 365, 532 [2] Koyama et al. 2007, PASJ, 59, S255 [3] Muno et al. 2003, ApJ, 589, 225 [4] Muno et al. 2006, ApJS, 165, 173 [5] Revnivtsev et al. 2006 We have observed the Galactic center (GC) regions using Suzaku/XIS. Distributions of X-ray emission lines of SXV (2.45 keV), FeI (6.4 keV), and FeXXV (6.7 keV) are clearly different. We examined the distributions of the Fe line intensity and the ratio of [6.9 keV]/[6.7 keV]. Averages of the line intensity ratio at |l| < 1 deg and |l| < 1 deg are 0.39 ± 0.06 and 0.21 ± 0.09, respectively. the origins of the GCDX and GRDX might be different. The 2-demensional distribution of the 6.7 keV line intensity was fitted with two exponential function (Dl1~0.07, Dl2~0.81). Comparing the distribution of surface brightness of the 6.7 keV emission and that of X-ray point sources, they are likely different while considering their systematical errors. This result will indicate that the GCDX cannot be explained only by the point sources.