Download
1 / 29
290 likes | 455 Views
The model of demand and supply is the most powerful tool in economics and is used to explain how prices are determined. Chapter 3 Where Prices Come From: The interaction of demand and Supply.

E N D
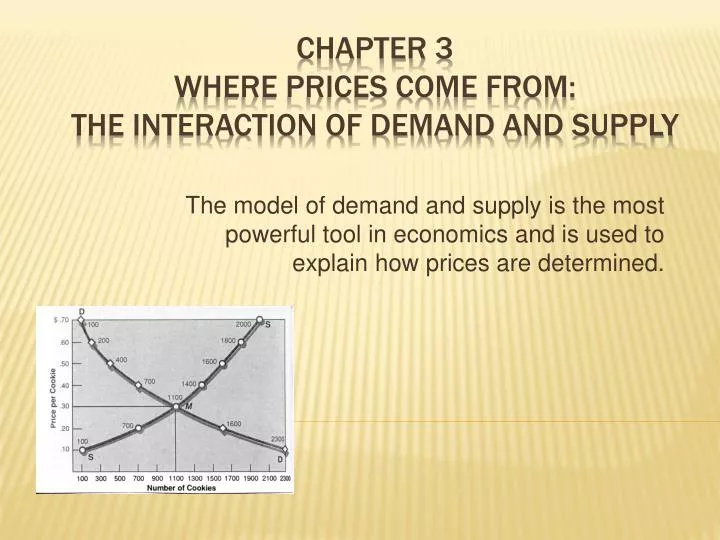
The model of demand and supply is the most powerful tool in economics and is used to explain how prices are determined. Chapter 3Where Prices Come From:The interaction of demand and Supply
Demand schedule- A table showing the relationship between the price of a product and the quantity of the product demanded. • Demand curve- A curve that shows the relationship between the price of a product and the quantity of the product demanded. The Demand side of the market
The rule that, holding everything else constant, when the price of a product falls, the quantity demanded of the product will increase, and when the price of a product rises, the quantity demanded of the product will decrease. The substitution effect and the income effect support this law. The law of demand
The change in the quantity demanded of a good that results from a change in price, making the good more or less expensive relative to other goods that are substitutes. Substitution effect
The change in the quantity demanded of a good that results from the effect of a change in the good’s price on consumers’ purchasing power. Income effect
The requirement that when analyzing the relationship between two variables—such as price and quantity demanded—other variables must be held constant. Only move one element so that we can identify the cause and effect Ceteris paribus (“all else equal”)
Income Price of related goods Tastes Populations and demographics Expected future prices Variables that shift market demand
The income that consumers have available to spend affects their willingness and ability to buy a good. • A normal good is a good for which the demand increases as income rises and decreases as income falls. • An inferior good is a good for which the demand increases as income falls and decreases as income rises. income
Substitutes- Goods and services that can be used for the same purpose. Complements- Goods and services that are used together. Prices of related goods
Consumers can also be influenced by an advertising campaign for a product. Trends, such as the popular low carbohydrate diets caused a decline for some goods, such as breads and an increase demand for goods such as beef. Tastes
Demographicsare the characteristics of a population with respect to age, race, and gender. • For example, as the number of senior citizens increases, prune juice, denture paste, and the demand for other products used by senior citizens will increase. Population and demographics
If enough consumers believe that HD TVs will be selling for lower prices in 3 months, the demand for TVs will decrease now, as consumers wait for the price to decrease. Expected Future Prices
A change in demand refers to a shift in the demand curve which occurs when there is a change in one of the variables, other than the price of the product, that affects the willingness of consumers to buy the products. A change in quantity demanded refers to the movement along the demand curve as a result of a change in the product’s price. A Change in Demand versus a Change in Quantity Demanded
The most important variable that influences the willingness and ability of firms to sell a good or service is PRICE. • With higher marginal costs, firms will supply a larger quantity only of the price is higher. The Supply Side of the Market
Supply schedule is a table that shows the relationship between the price of a product and the quantity of the product supplied. • Supply curve is a curve that shows the relationship between the price of a product and the quantity of the product supplied. • Law of supply is the rule that, holding everything else constant, increases in price cause increases in the quantity supplied, and vice-versa. Supply schedules and supply curves
Prices of Inputs Technological Change Prices of Substitutes in Production Number of Firms in Market Expected Future Prices Variables that shift supply
Inputs are used in the production of the good or service. Could make this less profitable. This is the factor most likely to shift the supply curve. Prices of Inputs
Technological change- A positive or negative change in the ability of a firm to produce a given level of output with a given quantity of inputs. Negative technological change is rare, but could come from a natural disaster. This raises a firms costs! Technological Change
These are the alternate products that the firm can produce. Prices of Substitutes in Production
When new firms enter the market, the supply curve shifts to the right and when existing firms exit, the supply curve shifts to the left. • For example, when the Zune was first introduced, the market supply curve for music players shifted to the right. Number of Firms in Market
If a firm expects the price of its product to be higher in the future than the price today, it may choose to decrease supply now and increase it in the future. Expected Future Prices
A change in supply means a shift of the supply curve. This will only shift when there is a change in one of the variables, other than the price of the product, that affects the willingness of suppliers to sell the product. A change in quantity supplied refers to the movement along the supply curve as a result of a change in the product’s price. A change in supply versus a change in quantity supplied
Market equilibrium- A situation in which quantity demanded equals quantity supplied. Market Equilibrium: Putting Demand and Supply Together
Surplus- quantity supplied is greater than the quantity demanded. Firms can increase their sales by cutting the price, simultaneously increasing the quantity demanded and decreasing the quantity supplied. Shortage- quantity demanded is greater than the quantity supplied. Firms can raise the price without losing a sale because the demand for the product is so high. How Markets Eliminate Surpluses and Shortages
The equilibrium is constantly changing! The Effect of Demand and Supply Shifts on Equilibrium