Download
1 / 20
200 likes | 299 Views
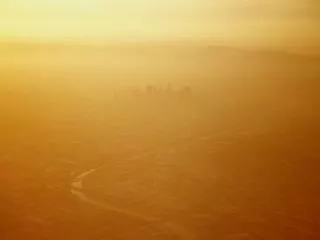
Ozone Transport to the Los Angeles Basin.

E N D
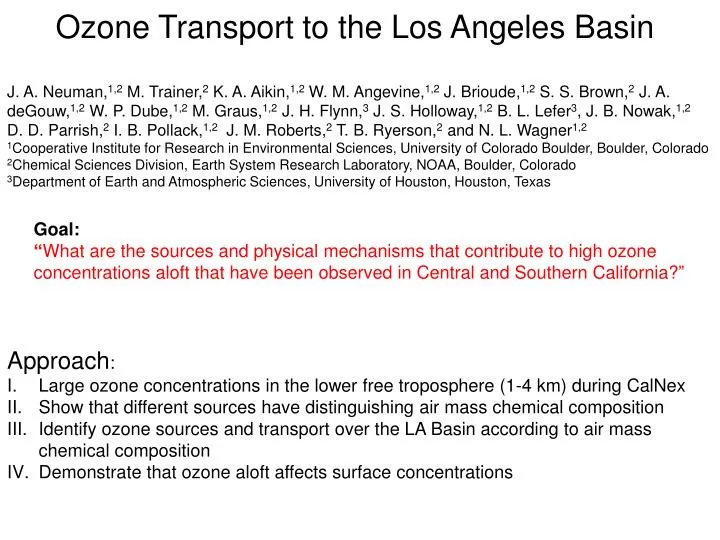
Ozone Transport to the Los Angeles Basin J. A. Neuman,1,2 M. Trainer,2 K. A. Aikin,1,2 W. M. Angevine,1,2 J. Brioude,1,2 S. S. Brown,2 J. A. deGouw,1,2 W. P. Dube,1,2 M. Graus,1,2 J. H. Flynn,3 J. S. Holloway,1,2 B. L. Lefer3, J. B. Nowak,1,2 D. D. Parrish,2 I. B. Pollack,1,2 J. M. Roberts,2 T. B. Ryerson,2 and N. L. Wagner1,2 1Cooperative Institute for Research in Environmental Sciences, University of Colorado Boulder, Boulder, Colorado 2Chemical Sciences Division, Earth System Research Laboratory, NOAA, Boulder, Colorado 3Department of Earth and Atmospheric Sciences, University of Houston, Houston, Texas Goal: “What are the sources and physical mechanisms that contribute to high ozone concentrations aloft that have been observed in Central and Southern California?” Approach: Large ozone concentrations in the lower free troposphere (1-4 km) during CalNex Show that different sources have distinguishing air mass chemical composition Identify ozone sources and transport over the LA Basin according to air mass chemical composition Demonstrate that ozone aloft affects surface concentrations
Experiment: • NOAA WP-3 aircraft flights over California in May and June 2010 • Fast, in-situ measurements of ozone, ozone precursors, and tracers • 7 daytime flights focused on LA Basin: May 4,8,14,16,19,21 and June 20, 2010 • Many vertical profiles between 0.2−4 km altitude Photo: Harald Stark Typical Flight Track over LA Basin
Aircraft Measurements MtnsLA Basin MtnsDesert Mixing Ratios (ppbv) LAHighMtns BasinDesert CO 300 200 100 NOx 10 2 0.1 HNO3 6 4 1 O3 80 80 80 • Ozone increased aloft (and everywhere)
Trace Gas Concentrations from 32 vertical profiles on 6 flights Average Boundary Layer Height • Composition similar at all locations from 1- 4 km (lower free troposphere) • In the boundary layer, concentrations largest closest to sources • Ozone increased in the lower free troposphere
Chemical composition identifies ozone sources and transport Possible sources for air over the Los Angeles Basin: Marine Aged regional emissions Stratosphere Asia Upper troposphere Use gas phase measurements to distinguish ozone sources: Water CO Reactive Nitrogen (HNO3, NOx, PAN) Next 4 slides: Show that each source has a distinct chemical signature
Chemical Composition Marine Over Pacific Ocean, May 8 150 m altitude Increased Concentrations: water Decreased Concentrations: Ozone, CO, HNO3, NOx
Chemical Composition Aged Regional Emissions Banning Pass, May 16 300-600 m AGL Increased Concentrations: water Ozone and CO (correlated) Reactive Nitrogen (partitions toward HNO3)
Chemical Composition Stratosphere/ Upper Troposphere Over Central Valley, May 11 UTStrat Stratosphere: Increased Concentrations: Ozone and HNO3 (correlated) Decreased Concentrations: CO, water Upper Troposphere: Increased Concentrations: Ozone Decreased Concentrations: CO, water, HNO3
Chemical Composition Transported Plumes from Asia Over Pacific Ocean, May 2002 Nowak, J. B., et al. (2004), Gas-phase chemical characteristics of Asian emission plumes observed during ITCT 2K2 over the eastern North Pacific Ocean, J. Geophys. Res., 109, D23S19, doi:10.1029/2003JD004488. Increased Concentrations: CO, PAN Decreased Concentrations: HNO3 Next 3 slides: Identify air masses over LA Basin during Calnex by their chemical composition
Ozone in the lower free troposphere over the LA Basin Profile in east LA Basin on May 4 Upper Tropospheric Boundary Layer • Decreased CO, water, HNO3 • Increased Ozone from Upper Tropospheric influence
Ozone in the lower free troposphere over the LA Basin Profile near Catalina Island on May 8 Upper Tropospheric Long Range Transport • Upper Troposphere: decreased CO, water, HNO3 • Long Range Transport: decreased water, HNO3; increased CO and PAN • Increased Ozone from Upper Troposphere and Long Range Transport
Ozone in the lower free troposphere over the LA Basin Profile over Redlands on May 16 Aged Regional Emissions Boundary Layer • Increased CO, water, HNO3 • Increased Ozone from Aged Regional Emissions
Summary of 32 vertical profiles Averages from 1.8 – 3.5 km altitude
Example: Downward mixing of ozone into LA Basin, May 14 Ozone:CO correlation • Gray points: Entire flight • Colored points: 0.2 – 0.8 km altitude over East LA basin • Dry air with increased ozone and low CO mixed into LA Basin
Example: Downward mixing of ozone into central valley, June 18 400 m AGL over San Joaquin Valley • Decreased CO, water, HNO3: Ozone from aloft mixed to surface • Increased CO, HNO3 Ozone from aged regional emissions Upper Tropospheric Influence Aged Regional Emissions
Implications 1. Ozone from upper troposphere an important source over the LA Basin.2. Downward mixing of ozone may have same temporal and spatial pattern as photochemical production.3. Entrainment of ozone from aloft affects correlations between ozone and tracers. 4. Ozone boundary condition at top of boundary layer is dynamic. Average values don’t reveal the conditions most important to exceedances.5. Downward mixing of ozone aloft especially important over high desert (deep boundary layers).6. Upper tropospheric influence seen in previous years, and could be monitored from commercial aircraft; Measurements of OZone, water vapour, carbon monoxide and nitrogen oxides by in-service AIrbusairCraft (MOZAIC) or In-service Aircraft for a Global Observing System (IAGOS).
Example: Increased ozone Joshua Tree National Park May 4 Boundary Layer • Decreased HNO3, water aloft. CO variable. Long Range Transport or Upper Troposphere • Over high desert, deep mixing layers entrain ozone aloft
Daily exceedances of 75 ppbv daily 8-hr average ozone at Joshua Tree National Park and Redlands, averaged from 2006-2010 Joshua Tree has more exceedances in the spring
MOZAIC (Measurements of OZone, water vapour, carbon monoxide and nitrogen oxides by in-service AIrbusairCraft May 12, 2005, in and out of LAX