Download
1 / 22
220 likes | 306 Views
Mesonet Observations during the UNSTABLE 2008 Pilot. David Sills 1 , Neil Taylor 2 , Craig Smith 3 , Geoff Strong 4 and John Hanesiak 5 1 Cloud Physics and Severe Weather Research Section, Environment Canada, Toronto, ON 2 Hydrometeorology and Arctic Lab, Environment Canada, Edmonton, AB

E N D
Mesonet Observations during the UNSTABLE 2008 Pilot David Sills1, Neil Taylor2, Craig Smith3, Geoff Strong4 and John Hanesiak5 1Cloud Physics and Severe Weather Research Section, Environment Canada, Toronto, ON 2Hydrometeorology and Arctic Lab, Environment Canada, Edmonton, AB 3Climate Research Division, Environment Canada, Saskatoon, SK 4University of Alberta (Adjunct), Edmonton, AB 5University of Manitoba, Winnipeg, MB 2009 CMOS Congress 31 May – 4 June, Halifax, NS
Outline • Mesonet Rationale • Instrument details • Observation Period and Methodology • Data Status • Preliminary Analysis • Fixed mesonet data • Mobile mesonet data • Plans for Full Experiment • Summary
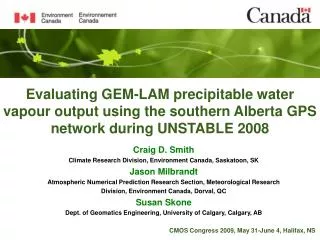
Rationale • Various severe weather studies have stressed the importance of mesoscale convergence boundaries and boundary-layer water vapour in thunderstorm development • Such boundaries and boundary-layer processes cannot be adequately resolved using existing synoptic-scale surface and upper-air observation networks on the Canadian Prairies • Surface mesonet with high spatial (~10 km) and temporal (2 s to 1 min) resolution need to resolve important boundary-layer processes important for convective initiation and severe storm development • Mobile observations needed to measure gradients and fill holes in / across mesonet on an ‘as-needed’ basis
Observation Periods UNSTABLE Study Period • Fixed mesonet stations and other selected fixed instrumentation from 1 June to 31 August Intensive Observation Period (IOP) • 9-23 July 2008 • Mobile platforms in full operation
5 x EC/MRD ATMOS Stations ATMOS = Automated Transportable Meteorological Observing System Mesonet - Fixed Platforms FOPEX = Foothills Orographic Precipitation Experiment 3 x EC/CRD FOPEX Stations 1 min T, Td, P, wind, pcpn 3 x ‘full’ UofC FCA Stations 1 min FastT, FastTd, P, 10m wind, pcpn, deltaT, insolation 1 min T, Td, P, wind, pcpn, insolation FCA = Foothills Climate Array
Mesonet - Mobile Platforms EC/MRD AMMOS Stations AMMOS = Automated Mobile Meteorological Observing System 2 sec T, Td, P, GPS UofA Mobile2 / EC Mobile3 2 sec FastT, FastTd, P, GPS, Wind, Compass, Lightning
Red Deer Calgary Mesonet • 5 ATMOS stations installed to create two mesonet lines incorporating existing FOPEX and FCA stations • High-density line with ~10-15 km spacing in region with highest frequency of CG lightning • Med-density line with ~15-25 km spacing in region where dryline bulging can occur, storms can affect Calgary • Allows testing of station placement and spacing • Two lines used as anchor points for IOD mission measurement strategies
Mobile Platform Transects • Routes predeter-mined given limited road network • Transects selected at beginning of day depending on the mission for that day • Preference given for transects with mesonet stations
FC/URSD • Data from selected fixed and mobile mesonet platforms were available in real-time to the field coordinator / UNSTABLE RSD • Mesoanalyses were generated showing current satellite / radar imagery, positions of boundaries • These assisted FC with positioning of mobile platforms
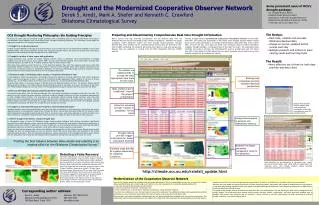
Data Status • Have developed suite of interactive quality control programs via MATLAB • All ATMOS station data have been QCd • AMMOS data require more attention, QC is underway • All photographs taken by the AMMOS teams have been QCd (time, location, direction, etc.)
Preliminary Analysis • Impact of mesonet stations • Characteristics of different • boundaries as sampled by • AMMOS
Operational Stations Only… Potential Temp (K)
With Mesonet Stations… Potential Temp (K)
Operational Stations Only… Mixing Ratio (g kg-1)
With Mesonet Stations… Mixing Ratio (g kg-1)
AMMOS Boundary Sampling July 9th Dryline + Outflow Boundary
20 sec Boundary width = ~300 m Mixing ratio gradient = 16.0 g kg-1 km-1 Potential temp gradient = 1.4 Kkm-1 AMMOS Boundary Sampling July 9th Dryline + Outflow Boundary Moving E @ ~60 km/h
Boundary width = ~700 m Mixing ratio gradient = 4.5 g kg-1 km-1 Potential temp gradient = 1.4 Kkm-1 AMMOS Boundary Sampling July 13th Dryline Boundary Moving NE @ ~50 km/h
Boundary width = ~860 m Mixing ratio gradient = 5.4 g kg-1 km-1 Potential temp gradient = 0.65 Kkm-1 AMMOS Boundary Sampling July 21st ‘Mystery’ Boundary Moving S @ ~40 km/h
Plans for Full Experiment (2012?) • All 10 ATMOS stations (with cell or sat phone communication) • 1-2 more AMMOS units for mobile met measurements • Situational awareness software for mobile units and FC (SASSI / VORTEX2) • Radar at centre of mesonet to detect radar fine lines at convergence zones
Summary • Mesonet with both fixed and mobile platforms successfully deployed for 2008 pilot study • Data QC and analysis are underway • Preliminary indications that dryline gradient is stronger that previously thought • Planning of mesonet for full UNSTABLE experiment has begun
Thank you / merci! D. Sills 2008