Download

1 / 24
240 likes | 253 Views
Snowfall Rate Retrieval with Satellite Passive Microwave Measurements and Algorithm Validation. Huan Meng 1 , Banghua Yan 1 , Ralph Ferraro 1 , Cezar Kongoli 2 , Jun Dong 2 1 NOAA/NESDIS, USA 2 Earth System Science Interdisciplinary Center, UMCP, USA. AMSU & MHS Sensors.

E N D
Snowfall Rate Retrieval with Satellite Passive Microwave Measurements and Algorithm Validation Huan Meng1, Banghua Yan1, Ralph Ferraro1, Cezar Kongoli2, Jun Dong2 1NOAA/NESDIS, USA 2Earth System Science Interdisciplinary Center, UMCP, USA
AMSU & MHS Sensors • AMSU: Advanced Microwave Sounding Unit • MHS: Microwave Humidity Sounder • Cross track scanning, mixed polarizations, onboard NOAA POES and EUMETSAT Metop satellites NOAA POES Satellite W: window channel; O: oxygen channel; V: water vapor channel AMSU-A1 AMSU-A2 MHS
Product Overview • Satellite retrieved (water equivalent) snowfall rate over global land • Uses measurements from AMSU and MHS • Main frequencies used: 23.8, 31.4, 89, 157, 190.31 GHz • Ancillary frequencies used: 50.3, 52.8, 53.6, 183.31±1, 183.31±3 GHz • The sensors are onboard 4 satellites: NOAA-18 (LTAN 14:30), NOAA-19 (13:30), MetOp-A (21:30) and MetOp-B (21:30) • Operational product at NOAA/NESDIS with near real-time production • Up to eightobservations per day at any location over global land • Resolution: 16 km x 16 km at nadir, 26 km x 52 km at limb
Methodology • Detect snowfall • Retrieve cloud properties with an inversion method • Compute snow particle terminal velocity and derive snowfall rate (Meng, et al.,2012)
Snowfall Detection (1/2) • Start with two operational products: AMSU rain rate (RR) (Ferraro et al., 2005; Zhao and Weng, 2002) and AMSU snowfall detection (SD) (Kongoli et al., 2003) • Apply filters (based on NWP T and RH profiles) to RR and SD due to misclassification and false alarm (Foster, et al., 2011) RR + SD SR RR + SD SR Misclassification False Alarm
Snowfall Detection (2/2) • Snow event in the Midwest, February 1, 2011. Comparison of satellite retrieved snowfall (rain retrieval not included) and ground observations of snowfall and rainfall The algorithm has the ability to differentiate between rain and snow correctly in most cases.
Retrieval of Cloud Properties (1/2) • Inversion method • Simulation of Tb’s with a two-stream, one-layer RTM (Yan et al., 2008) • Iteration scheme with ΔTBi thresholds • IWP and De are retrieved when iteration stops Ic: ice water path De: ice particle effective diameter i: emissivity at 23.8, 31.4, 89, 157, and 190.31 GHz TBi: brightness temperature at 23.8, 31.4, 89, 157, and 190.31 GHz A: derivatives of TBi over IWP, De, and i E: error matrix
Retrieval of Cloud Properties (2/2) • RTM assumptions • Number density of ice particles follows exponential distribution • Spherical habit, use Mie calculation • Fixed ice particle density • TPW and Ts are not retrievals, obtained from NCEP GDAS data. Use GFS in operation.
Terminal Velocity • Heymsfield and Westbrook (2010): : dynamic viscosity of air, Re: Reynolds number, a : air density, D: maximum dimension of the ice particle • Re = f(Ar), area ratio Ar = A/(D2/4); Ar = 1 for spherical ice particle • Assume spherical ice particles in this study
Snowfall Rate • Assumptions • Same assumptions as the RTM: spherical habit, exponential distribution, fixed ice particle density • Constant ice water content (IWC) in the cloud column. Compensate for the non-uniform distribution with a scaling factor, a • Model , • Integration is solved numerically using Romberg's method
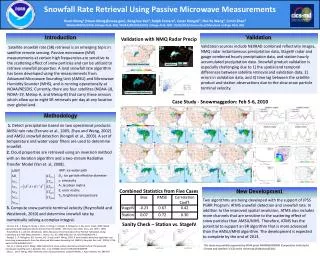
Validation • Validation Sources • NEXRAD base reflectivity images • Station hourly accumulated precipitation data (NOAA/NCDC QCLCD) • StageIV radar and gauge combined hourly precipitation data (0.25 deg data provided by J. Janowiak) • National Mosaic & Multi-Sensor QPE (NMQ) radar precipitation data (NOAA/NSSL) • Validation challenges • Spatial scale difference with station data: 16+ km footprint vs. point measurement • Temporal scale difference with station/StageIV data: instantaneous vs. hourly • Other issues with ground observations and radar snowfall data • Station: Undercatch (underestimation) due to dynamic effect • StageIV/NMQ: Range effect, overestimation at the presence of melting snowflakes • Accuracy • Time delay between satellite measurements and ground observations
Validation with NEXRAD Image • Use NEXRAD reflectivity images to • Track snowstorm evolution • Check snowfall extent • Qualitatively compare snowfall intensity
Mid-Atlantic Snowstorm Feb 5-6, 2010 SFR (mm/hr)
Validation Events • Five large-scale heavy snowfall events from 2009-2010 • Jan 27-28, 2009 • Mar 23-24, 2009 • Dec 08-09, 2009 • Jan 28-30, 2010 • Feb 05-06, 2010 • The events cover diverse geographic areas and climate zones
Validation with Station and StageIV Data • Station • Correlation coefficients between AMSU SR and station data by time lag between the two measurements • Use station data with 60-120 min time lag from satellite • Distance between station and satellite data 50 km • Underestimation (snow undercatch) due to dynamic effects • StageIV and NMQ • Overestimation for melting snowflakes • Cutoff at 5 mm/hr
Case Study 2: Feb 5-6, 2010 (1/3) • A category 3 (“major"), record breaking nor'easter (aka "Snowmaggedon“) hit the mid-Atlantic region with 20” to 35” of snow • Strong El Nino + North Atlantic Oscillation in a negative phase • The blocked pattern allows the northern and southern jet streams to phase over eastern US and transfer of energy provide the forcing for the major snowstorm • A very strong moisture plume with the southern stream provided abundant moisture to mid-Atlantic region 500 hPa geopotential height (m) (Jackson and Zubrick, 2010) TPW percent of normal (Jackson and Zubrick, 2010) GOES IR 2/5/2010, 23Z Skier in front of the Capitol
Case Study 2: Feb 5-6, 2010 (2/3) • Time series of areal mean, bias, and correlation coefficient • Evolution of mean SR is in very good agreement with Stage IV and station data • Mean SR are either comparable to StageIV and station data or have negative bias against the two sources except with station in later stage • Better correlation with StageIV, mostly 0.3-0.6
Case Study 2: Feb 5-6, 2010 (3/3) Images of matching data • StageIV • Station
Summary Statistics • Combined statistics of all five events • Accuracy is the (sample size) weighted average bias of all events • Precision is the (sample size) weighted average RMSE of all events • Correlation is the (sample size) weighted average correlation coefficient • Sanity check - Comparison between StageIV and Station
Validation with NMQ (1/3) • Validation with NMQ instantaneous radar precipitation rate • NMQ radar only data: 0.01 degree, every 5 minutes • Better comparability in spatial (radar weighted average) and temporal collocations between satellite and radar • NMQ has considerable positive bias against other precip data (Y. Tian) • Snowfall event on March 24-25, 2013 (30 hrs):
Validation with NMQ (3/3) Time series of mean snowfall rate from satellite and radar Time series of bias and correlation coefficient between satellite and radar snowfall rate
Future Plans • Advanced Technology Microwave Sounder (ATMS) • ATMS is the follow-on sensors to AMSU and MHS • ATMS is onboard NPP and future JPSS satellites • ATMS snowfall project funded by JPSS Proving Ground program • Complete prototype algorithms by the end of 2013 • ATMS snowfall products: snowfall detection, snowfall rate • More snow-sensitive channel for improved snowfall retrieval • Extension to colder regions
Conclusions • The operational AMSU/MHS snowfall rate product can provide up to 8 snowfall rate retrievals per day over global land • The product follows well the evolution of hourly snowfall data of StageIV and station; and especially well the evolution of instantaneous NMQ snowfall data • In spite of the large scale discrepancies, AMSU SR have good correlation with StageIV data (0.42) and with station data (0.30) for the five events studied. The correlation coefficient with NMQ is the highest (0.44) due to better spatial and temporal compatibility. • AMSU SR have low positive bias (0.07 mm / hr) against station data and higher negative bias (-0.23 mm/hr) against StageIV data for the five events studied. The bias against NMQ is -0.31.