Download
1 / 41
430 likes | 603 Views
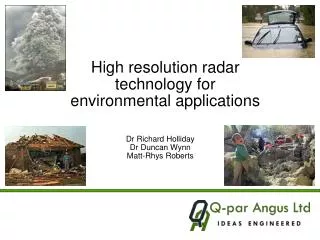
High resolution radar technology for environmental applications. Dr Richard Holliday Dr Duncan Wynn Matt-Rhys Roberts. Content. Introduction Survey methods - manual - LIDAR/hyper-spectral, thermal imaging - RADAR/ real-beam mapping/SAR, interferometric SAR

E N D
High resolution radar technology for environmental applications Dr Richard Holliday Dr Duncan Wynn Matt-Rhys Roberts
Content • Introduction • Survey methods- manual - LIDAR/hyper-spectral, thermal imaging - RADAR/ real-beam mapping/SAR, interferometric SAR • Overview of high resolution radar • Environmental applications- mapping - remote sensing and surveillance - pollution monitoring
Introduction • A major threat to global stability is the change in the Earth’s climate • Extremes of heat and drought, storms, wind, rain and more intense cold • Unpredictable environmental behaviour - Temperature rises are likely to be non-uniform across the globe • Uncertainty of the impact is incorporated into long-term national and international decision-making - reflected in environmental standards and targets including : - protection of people, homes and business from risk of flood - ensure availability of suitable water for drinking and bathing - prevention of destruction of natural habitats and extinction of animal species - There is a very wide breadth of environmental issues …..
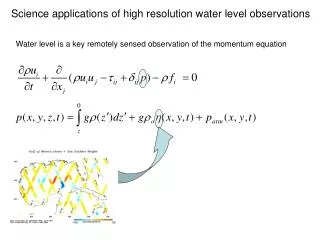
Climate change .. evidence Winter and Summer rainfall rates 1766 to 1991
Introduction • Better understanding of the complex interaction between the Earth’s surface and atmosphere is essential • Accurate descriptions of local and regional surface features and associated phenomena with timely monitoring are vital
Survey methods • The quality of surface maps is gauged primarily by the ability of the survey method and sensor to resolve closely spaced features …. generally defined in terms of resolution Historically, surface feature (map or topographic) data has been obtained by manual survey methods • Autonomous - surface based - airborne
Survey methods : Manual • Wide variety of methods - traditional survey, laser based, GPS based - passive samplers, ultrasonic gauges etc • Labour intensive • Time consuming … untimely data/latency ? • Poor spatial coverage • Low spatial resolution – point sensors/measurements • Invasive – perturbation of measurement environment • Limited by accessibility of environment - ad-hoc methods such as General Quality Assessment (GQA for rivers) • Inaccurate and inconsistent – requires accreditation and standardisation • Autonomous survey solutions are required ….
Survey methods : Automatic flow monitoring • Time consuming … untimely data/latency ? • Poor spatial coverage • Low spatial resolution – point sensors/measurements • Invasive – perturbation of measurement environment • Limited by accessibility of environment • Inconsistent – requires accreditation and standardisation
Survey methods : Airborne • LIght Detection And Ranging (LIDAR) • Wide area coverage – typically 600 m swathe width at 800m altitude • Measurements every 2m with resolution between 1m and 10m • Compact Airborne Spectral Imager (CASI) • Thermal imager / daylight camera
Disadvantages of LIDAR • High operating costs (> £10k / hour) • Not all-weather performance - ineffective during heavy rain and/or low cloud/mist - degraded at high Sun angles and reflections • Latency – data not processed locally (Coventry airport/OS) • Unreliable for water depth (< 2m) and breaking/turbulent waves • Lack of foliage/vegetation penetration
Survey methods : Real-beam mapping radar • Wide area coverage – surface, airborne / satellite borne • All-weather capability
Real-beam mapping radar Ludlow X-band (10 GHz) 1° beamwidth 100m range resolution Hereford
Real-beam mapping radar X-band (10 GHz) radar and video based measurements from a traffic scene (circa 1968) 77 GHz radar and video based measurements from a traffic scene (circa 1998)
Survey methods : Synthetic Aperture Radar (SAR) • Wide area coverage – airborne / satellite borne • All-weather capability • Costs - Capital costs typically >£100 k excl. aircraft installation and maintenance > £1m for satellite payloads - Operating costs typically > £10k / hour
Synthetic aperture radar (SAR): Airborne X-band (10 GHz) 1° beamwidth 0.3m range resolution
Synthetic aperture radar (SAR): Satellite-borne TOPEX/POSEIDON ocean topography project
Disadvantages of microwave real-beam and SAR radar • SAR imagery is prone to distortions, obscuration and RF interference • Lack of foliage/vegetation and surface penetration • Speckle cancellation is required • Latency – data not processed locally - Time dependent phenomena are not imaged • Moving object detection with MTI radar modes • Lack of availability • Ownership of data • Cost
Distortion of SAR imagery Optical and SAR view of same airfield
High resolution radar operating modes • High resolution mapping • Velocimetry • Target classification - Polarimetry - Non-cooperative Target Recognition (NCTR) • Bathymetry
Outline radar specification (target) Modes:High resolution surface mapping (2D and 3D) Velocimetry max. velocity < 15 m/s (33 mph / 54 km/hr) Bathymetry < 2m water depthClassification / non-cooperative target recognition surface texture, birds, insects, humans Coverage: 360° azimuth, ± 40° elevation Resolution: spatial < 0.03m (range), < 0.05m (azimuth) at 300m velocity < 0.003 m/s or ±0.01% max. velocity Sensitivity: > 10 dB SNR at 5 km against 1m2 non-fluctuating, stationary target Polarisation: Fully polarimetric Physical: weight under 80 kg maximum size 1m x 1m x 1m Integral navigation unit including GPS and INS
High resolution radar • Angular resolution (related to antenna beamwidth and physical size) improves at millimetric/sub-millimetric wavelengths… but atmospheric attenuation is worse 3dB beamwidth of 1m antenna is typically 1° at 94 GHz
High resolution radar : Atmospheric attenuation 150 GHz 94 GHz “windows”
High resolution radar • Radar technology at millimetric/sub-millimetric wavelengths is more affordable • Hardware at millimetric/sub-millimetric wavelengths is physically small …. portable and hand-held equipment is convenient Slot antenna
High resolution radar • Portable high resolution radar is able to exploit improved geometry to overcome distortion and obscuration • Multiple radars can be networked for simultaneous coverage • Surface based measurements underneath tree-canopies overcome foliage and vegetation shielding • RF electromagnetic spectrum is sparsely occupied at millimetric/sub-millimetric wavelengths … very low probability of RF interference
High resolution radar • 10 dB SNR against 1m2 non-fluctuating target at 5.5 km with RF transmitter input power 50 mW • >5% RF bandwidth at 94 GHz for better than 0.5 m range resolution • Multi-frequency RF transmission to mitigate multipath Typical radar performance Target RCS 1m2, radar height 1m
Velocimetry • Determination of velocity vector of scattering centre within resolution cell by separate or multiple radar measurements V(n) Resolution cell n VD(n) VE(n) VA VN(n) A Radar position B Reference A Radar position A Velocity vector of resolution cell, n Measured radial velocity VA of resolution cell n, projected at angle A A V(n)=VN(n)+VE(n)+VD(n)
Classification: Polarimetry • Radar returns are polarisation dependent – offers best opportunity for classification • A fully polarimetric high resolution radar will record four separate complex reflectivities for the same scene • Radar image texture can be interpreted as environmental features such as trees, hedges, fields (bare soil and vegetation), hills, ditches, bridges, shadows, buildings, roads, rivers and fences • Texture can be measured by RCS of clutter CDF and moments of distribution • Discrimination between type of vegetation is possible • Close interaction with surface with topology data - roughness and soil moisture retrieval are possible
Classification: Non-cooperative Target Recognition (NCTR) • Radar cross-section is enhanced by large number of point scatterers at millimetric wavelengths • Scattering centres are discernible from measurements with high spatial and temporal resolution • RCS is dependent upon aspect angle to radar • Target motion compensation and RCS database collation is effective • Target classification algorithms are widely available, such as template matching • Target motion can be exploited with Inverse Synthetic Aperture (ISAR) imaging
Bathymetry • Water depth can be determined from measurements of surface water wavelengths, directions and velocities … requires high spatial and temporal resolution Y X
Bathymetry • Combined with velocimetry
FMCW radar Foster scanner antenna 94 GHz FMCW radar
High resolution radar Typical antenna radiation pattern 94 GHz co-polar 3 dB beamwidth 0.1o
Super-resolution • Resolution limit defined by classical Rayleigh criterion can be improved by a factor of between 2 and 3 • Facilitated by : - rapid update rates - stable antenna scanning (> 400 rpm) - advanced signal processing - MUSIC / IMP / MAP algorithms
Environmental applications : Mapping • Land topography, elevation modelling and height contour plots • Land cover classification, landscape and habitat survey - model validation to link land use with soil type and erosion prediction - crop and animal stock monitoring and grazing management for sustainable farming • Road survey and highway mapping • Flood plain surveys (with/without flooding) • Surface water mapping including rivers, streams, canals, sewers - water flow rates, direction and depth monitoring, bathymetric mapping - identification and tracking of dissimilar bodies of water - mapping of mixing zones, outfalls and rivers • Inter-tidal vegetation mapping • Coastal erosion, tidal action and geomorphology
Environmental applications : Remote sensing and surveillance • Monitoring of water abstraction and discharges for review of permits • Meteorological measurements of fog, cloud and precipitation including ice particle size, internal circulations in fair weather, drop size distributions in rain and drizzle in shallow continental stratus cloud • Wind speed and direction, storm direction, cloud base and cloud top detection • Bird, insect and wildlife monitoring as a measure of water and environmental quality in conjunction with control measures • Ecological surveys including number and distribution of specific wildlife (bird) species • Personnel and livestock location and identification • Fire and smoke monitoring of forested areas
Environmental applications : Pollution detection • Water detritus content warning - litter, oil, surface scum, foam, sewage fungus, ochre, buoys, floats, jetsom/flotsom • Pollution monitoring of water reservoirs • Air quality monitoring - Open-path monitoring from 10 m to over 1 km - detection and tracking of aerosols, airborne particulates (smoke), atmospheric absorption - detection of gaseous compounds in ambient air