Download
1 / 21
210 likes | 333 Views
Jameson Miller UNC Chapel Hill. Cory W. Quammen UNC Chapel Hill. Interactive Visualization of Intercluster Galaxy Structures in the Horologium-Reticulum Supercluster. Matthew C. Fleenor Roanoke College. Data description. Galaxy positions in RA-DEC-cz coordinate system

E N D
Jameson Miller UNC Chapel Hill Cory W. QuammenUNC Chapel Hill Interactive Visualization of Intercluster Galaxy Structures in the Horologium-Reticulum Supercluster Matthew C. FleenorRoanoke College
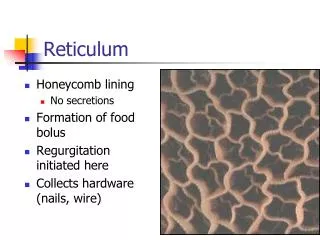
Data description • Galaxy positions in RA-DEC-cz coordinate system • Right-ascension (RA) ~ longitude • Declination (DEC) ~ latitude • cz – radial dimension (recessional velocity) • ~2500 galaxy locations • ~30 clusters
Domain questions • What is the distribution of intercluster galaxies? • Are there large void regions? How many? • Does the supercluster have filaments? • How do clusters fit into the structure defined by intercluster galaxies?
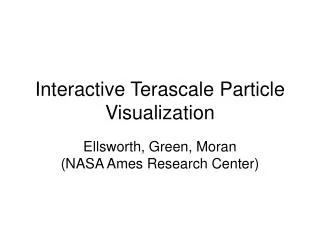
Prior 3D experience • Collaborators viewed data in immersive environment • Got lost – no context
Previous interactive tools • Cosmic Explorer [Song1993] • SGI Explorer [Christensen1995] • PartiView [Levy2001] • AstroMD [Gheller2002]
What’s missing • Ability to group galaxies into structures they define • Voids • Filaments • Reference axes in all three RA-DEC-cz dimensions
Data types • Sparse 3D position data • Nominal (categorical) data • Intercluster galaxies vs. clusters • User-defined groups indicating structure (filament, void boundary) Group 1 Group 2 InterclusterGalaxy Cluster …
Nominal encoding • 3D glyphs • Enough screen real estate • Distinct shapes encode object type • Depth queues from perspective and occlusion • Nominal color encoding • Group membership • Encoded by 10 of 12 colors recommended by Ware2004
RA-DEC-cz reference axes • Orientation to dataset • Colored with just-noticeably-different color than background • Can turn sides, top, and bottom on or off
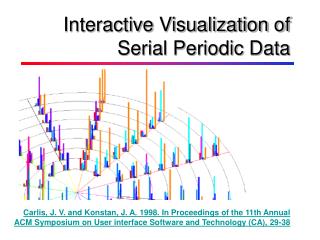
Curved drop lines • Explicit connection between galaxies and reference axes • Curved to fit RA-DEC-cz coordinate system • Allows comparison to standard plots
Structure perception • Structure-from-motion • Strongest shape cue • Torsional rocking • Structure-from-motion without interaction • Stereo • Complements other techniques • User can control eye-separation parameter
Confirmation of analysis • Quantitative analysis shows two separate overdensities • Overdensities pop out in visualization • ~95% correspondence between grouping by hand and quantitative grouping
Positive result • Quick identification of void regions • Selection of galaxies along rim defines bounds of void • Offline sphere-fitting refines estimation • Six voids identified • Known clusters reside around voids
Negative result • Previous 2D plots identified potential filament structure • When rotated in 3D, filament is shown to be two separate structures
Computation vs. visualization • Voids – could compute • Filaments – maybe could compute • Visualization helps astronomers know where to focus quantitative analysis
Effective techniques • User-controlled interaction • Critical for maintaining viewer orientation • Interactive scaling allows snapping between overview of data and local features, giving context when zooming in • Home key moves back to a familiar orientation • Torsional rocking • Rocking aids void definition when far galaxies peek out from closer galaxy • View angle optimization • Stereo • Stereo is helpful for finding galaxies bordering voids • Picking with mouse was hampered by stereo • Collaborators came across campus to use it!
Software • Called GyVe (GalaxyViewer) • Built on VTK, Python, and Tkinter • Available at http://gyve.sourceforge.net/ • Runs on Windows and Linux
Future work • Isosurfaces – initial attempt unused • Image processing for identifying voids from density projections • Add interactive statistical tools • Haptic probes to feel around for structures
Acknowledgements • NSF Grant AST 04-06443 (Fleenor) • James A. Rose • Russell M. Taylor II