Download
1 / 14
140 likes | 254 Views
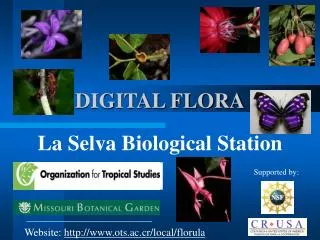
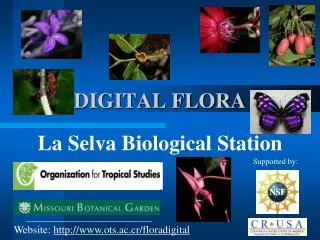
Interactive Information Visualization in the Digital Flora of Texas. John J. Leggett Center for the Study of Digital Libraries Texas A&M University. Introduction. Digital Flora of Texas collaborative research effort web-accessible collections

E N D
Interactive Information Visualization in the Digital Flora of Texas John J. Leggett Center for the Study of Digital Libraries Texas A&M University
Introduction • Digital Flora of Texas • collaborative research effort • web-accessible collections • botanists and botanically-interested non-specialists • Herbarium Specimen Browser (HSB) • main portal to the collections • ~ 300,000 specimen records • 13 herbaria
Herbarium Specimen Browser • Hierarchical taxonomic browser • expansion in context • Detailed specimen listings • Specimen and species distribution maps • Full-text querying on specimen records • Stackable bar graph displays showing temporal aspects of the specimens
Visualizing Temporal Specimen Data • Herbarium bar graphs provide numerical summary of individual collections • Stackable herbaria bar graphs provide collective numerical summary and comparative analysis • Daily and Weekly bar graphs • flowering periods • collection activities • Yearly bar graphs • historical analysis of herbaria • influence of curator or individual collector
Example • Objective: Learn about collection activities of the Brassicaceae family • browse or query for Brassicaceae • see species and specimen counts and listing • map density and distribution • graph by herbaria, daily, weekly, yearly • use distribution maps or bar graphs to find collectors, locations, dates, etc.
Summary • Digital libraries supporting/changing scientific practice • Collaborative research driven by needs of biologists (botanists, ecologists) • Interactive information visualizations in support of daily scientific practice and education • Many benefits • cleaner data, comparative analyses, data mining • generate collection activities/educational opportunities • wide audience • endangered and protected species
URLs • Digital Flora of Texas: • http://www.texasflora.org • Herbarium Specimen Browser: • http://www.csdl.tamu.edu/FLORA/tracy2/main1.html