Download
1 / 49
490 likes | 589 Views
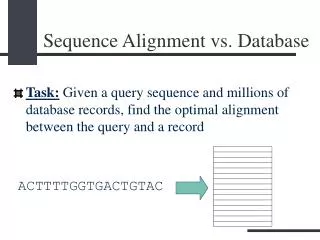
Sequence Alignment and Database Searching. Biological Motivation. Inference of Homology Two genes are homologous if they share a common evolutionary history. Evolutionary history can tell us a lot about properties of a given gene Homology can be inferred from similarity between the genes

E N D
Biological Motivation • Inference of Homology • Two genes are homologous if they share a common evolutionary history. • Evolutionary history can tell us a lot about properties of a given gene • Homology can be inferred from similarity between the genes • Searching for Proteins with same or similar functions
Orthologous and Paralogous Orthologous sequences differ because they are found in different species (a speciation event) Paralogous sequences differ due to a gene duplication event Sequences may be both orthologous and paralogous
Protein Evolution “For many protein sequences, evolutionary history can be traced back 1-2 billion years” -William Pearson When we align sequences, we assume that they share a common ancestor They are then homologous Protein fold is much more conserved than protein sequence DNA sequences tend to be less informative than protein sequences
Sequence Alignment Global Alignment: Input: two sequences S1, S2 over the same alphabet Output: two sequences S’1, S’2 of equal length (S’1, S’2 are S1, S2 with possibly additional gaps) Example: • S1= GCGCATGGATTGAGCGA • S2= TGCGCCATTGATGACC • A possible alignment: S’1=-GCGC-ATGGATTGAGCGA S’2= TGCGCCATTGAT-GACC-- Goal: How similar are two sequences S1 and S2
Sequence Alignment Local Alignment: Input: two sequences S1, S2 over the same alphabet Output: two sequences S’1, S’2 of equal length (S’1, S’2 are substrings of S1, S2 with possibly additional gaps) Example: • S1=GCGCATGGATTGAGCGA • S2=TGCGCCATTGATGACC • A possible alignment: S’1=ATTGA-G S’2= ATTGATG Goal: Find the pair of substrings in two input sequences which have the highest similarity
Sequence Alignment -GCGC-ATGGATTGAGCGA TGCGCCATTGAT-GACC-A Three elements: • Perfect matches • Mismatches • Insertions & deletions (indel) • Score each position independently • Score of an alignment is sum of position scores
Global vs. Local Alignments Global alignment algorithms start at the beginning of two sequences and add gaps to each until the end of one is reached. Local alignment algorithms finds the region (or regions) of highest similarity between two sequences and build the alignment outward from there.
Global Alignment (Needleman -Wunsch) The the Needleman-Wunsch algorithm creates a global alignment over the length of both sequences (needle) Global algorithms are often not effective for highly diverged sequences - do not reflect the biological reality that two sequences may only share limited regions of conserved sequence. Sometimes two sequences may be derived from ancient recombination events where only a single functional domain is shared. Global methods are useful when you want to force two sequences to align over their entire length
Local Alignment (Smith-Waterman) Local alignment Identify the most similar sub-region shared between two sequences Smith-Waterman
Properties of Sequence Alignment and Search • DNA • Should use evolution sensitive measure of similarity • Should allow for alignment on exons => searching for local alignment as opposed to global alignment • Proteins • Should allow for mutations => evolution sensitive measure of similarity • Many proteins do not display global patterns of similarity, but instead appear to be built from functional modules => searching for local alignment as opposed to global alignment
Parameters of Sequence Alignment Scoring Systems: • Each symbol pairing is assigned a numerical value, based on a symbol comparison table. Gap Penalties: • Opening: The cost to introduce a gap • Extension: The cost to elongate a gap
Pairwise Alignment The alignment of two sequences (DNA or protein) is a relatively straightforward computational problem. There are lots of possible alignments. Two sequences can always be aligned. Sequence alignments have to be scored. Often there is more than one solution with the same score.
Methods of Alignment By hand - slide sequences on two lines of a word processor Dot plot with windows Rigorous mathematical approach Dynamic programming (slow, optimal) Heuristic methods (fast, approximate) BLAST and FASTA Word matching and hash tables0
Align by Hand GATCGCCTA_TTACGTCCTGGAC <-- --> AGGCATACGTA_GCCCTTTCGC You still need some kind of scoring system to find the best alignment
Percent Sequence Identity The extent to which two nucleotide or amino acid sequences are invariant A C C T G A G – A G A C G T G – G C A G mismatch indel 70% identical
Considerations • The window/stringency method is more sensitive than the wordsize method (ambiguities are permitted). • The smaller the window, the larger the weight of statistical (unspecific) matches. • With large windows the sensitivity for short sequences is reduced. • Insertions/deletions are not treated explicitly.
Alignment methods Rigorous algorithms = Dynamic Programming Needleman-Wunsch (global) Smith-Waterman (local) Heuristic algorithms (faster but approximate) BLAST FASTA
Dynamic Programming Dynamic Programming is a very general programming technique. It is applicable when a large search space can be structured into a succession of stages, such that: the initial stage contains trivial solutions to sub-problems each partial solution in a later stage can be calculated by recurring a fixed number of partial solutions in an earlier stage the final stage contains the overall solution
Creation of an alignment path matrix • If F(i-1,j-1), F(i-1,j) and F(i,j-1) are known we can calculate F(i,j) • Three possibilities: • xiand yj are aligned, F(i,j) = F(i-1,j-1) + s(xi ,yj) • xi is aligned to a gap, F(i,j) = F(i-1,j) - d • yjis aligned to a gap, F(i,j) = F(i,j-1) - d • The best score up to (i,j) will be the largest of the three options
Creation of an alignment path matrix Idea:Build up an optimal alignment using previous solutions for optimal alignments of smaller subsequences • Construct matrix F indexed by i and j (one index for each sequence) • F(i,j) is the score of the best alignment between the initial segment x1...iof x up to xiand the initial segment y1...jof y up to yj • Build F(i,j) recursively beginning with F(0,0) = 0
E E Backtracking H E A G A W G H E E 0 -8 -16 -24 -32 -40 -48 -56 -64 -72 -80 P -8 -2 -9 -17 -25 -33 -42 -49 -57 -65 -73 A -16 -10 -3 -4 -12 -20 -28 -36 -44 -52 -60 W -24 -18 -11 -6 -7 -15 -5 -13 -21 -29 -37 H -32 -14 -18 -13 -8 -9 -13 -7 -3 -11 -19 E -40 -22 -8 -16 -16 -9 -12 -15 -7 3 -5 A -48 -30 -16 -3 -11 -11 -12 -12 -15 -5 2 E -56 -38 -24 -11 -6 -12 -14 -15 -12 -9 1 0 -8 -16 -17 -25 -20 -5 -13 -3 3 -5 1 H - E - A P G - G - H H E E - A A A W W Optimal global alignment:
actaccagttcatttgatacttctcaaa taccattaccgtgttaactgaaaggacttaaagact DNA Scoring Systems -very simple Sequence 1 Sequence 2 A G C T A1 0 0 0 G 0 1 0 0 C 0 0 1 0 T 0 0 0 1 Match: 1 Mismatch: 0 Score = 5
ProteinScoring Systems Sequence 1 Sequence 2 PTHPLASKTQILPEDLASEDLTI PTHPLAGERAIGLARLAEEDFGM C S T P A G N D. . C 9 S -1 4 T -1 1 5 P -3 -1 -1 7 A 0 1 0 -1 4 G -3 0 -2 -2 0 6 N -3 1 0 -2 -2 0 5 D -3 0 -1 -1 -2 -1 1 6 . . C S T P A G N D. . C 9 S -1 4 T -1 1 5 P -3 -1 -1 7 A 0 1 0 -1 4 G -3 0 -2 -2 0 6 N -3 1 0 -2 -2 0 5 D -3 0 -1 -1 -2 -1 1 6 . . Scoring matrix T:G = -2 T:T = 5 Score = 48
ProteinScoring Systems • Amino acids have different biochemical and physical properties that influence their relative replaceability in evolution. tiny P aliphatic C small S+S G G I A S V C N SH L D T hydrophobic Y M K E Q F W H R positive aromatic polar charged
ProteinScoring Systems • Scoring matrices reflect: • # of mutations to convert one to another • chemical similarity – observed mutation frequencies – the probability of occurrence of each amino acid • Widely used scoring matrices: • PAM • BLOSUM
PAM matrices Family of matrices PAM 80, PAM 120, PAM 250 The number with a PAM matrix represents the evolutionary distance between the sequences on which the matrix is based Greater numbers denote greater distances
PAM (Percent Accepted Mutations) matrices • The numbers of replacements were used to compute a so-called PAM-1 matrix. • The PAM-1 matrix reflects an average change of 1% of all amino acid positions. PAM matrices for larger evolutionary distances can be extrapolated from the PAM-1 matrix. • PAM250 = 250 mutations per 100 residues. • Greater numbers mean bigger evolutionary distance .
PAM (Percent Accepted Mutations) matrices • Derived from global alignments of protein families . Family members share at least 85% identity (Dayhoff et al., 1978). • Construction of phylogenetic tree and ancestral sequences of each protein family • Computation of number of replacements for each pair of amino acids
PAM - limitations Based on only one original dataset Examines proteins with few differences (85% identity) Based mainly on small globular proteins so the matrix is biased
BLOSUM (Blocks Substitution Matrix) • Derived from alignments of domains of distantly related proteins (Henikoff & Henikoff,1992). • Occurrences of each amino acid pair in each column of each block alignment is counted. • The numbers derived from all blocks were used to compute the BLOSUM matrices. A A C E C A A C E C A - C = 4 A - E = 2 C - E = 2 A - A = 1 C - C = 1
BLOSUM matrices Different BLOSUMn matrices are calculated independently from BLOCKS (ungapped local alignments) BLOSUMn is based on a cluster of BLOCKS of sequences that share at least n percent identity BLOSUM62 represents closer sequences than BLOSUM45
BLOSUM (Blocks Substitution Matrix) • Sequences within blocks are clustered according to their level of identity. • Clusters are counted as a single sequence. • Different BLOSUM matrices differ in the percentage of sequence identity used in clustering. • The number in the matrix name (e.g. 62 in BLOSUM62) refers to the percentage of sequence identity used to build the matrix. • Greater numbers mean smaller evolutionary distance.
PAM Vs. BLOSUM PAM100 = BLOSUM90 PAM120 = BLOSUM80 PAM160 = BLOSUM60 PAM200 = BLOSUM52 PAM250 = BLOSUM45 More distant sequences • BLOSUM62 for general use • BLOSUM80 for close relations • BLOSUM45 for distant relations • PAM120 for general use • PAM60 for close relations • PAM250 for distant relations
PAM Matricies • PAM 40 - prepared by multiplying PAM 1 by itself a total of 40 times best for short alignments with high similarity • PAM 120 - prepared by multiplying PAM 1 by itself a total of 120 times best for general alignment • PAM 250 - prepared by multiplying PAM 1 by itself a total of 250 times best for detecting distant sequence similarity
BLOSUM Matricies • BLOSUM 90 - prepared from BLOCKS sequences with >90% sequence ID best for short alignments with high similarity • BLOSUM 62 - prepared from BLOCKS sequences with >62% sequence ID best for general alignment (default) • BLOSUM 30 - prepared from BLOCKS sequences with >30% sequence ID best for detecting weak local alignments
TIPS on choosing a scoring matrix • Generally, BLOSUM matrices perform better than PAM matrices for local similarity searches (Henikoff & Henikoff, 1993). • When comparing closelyrelatedproteins one should use lower PAMor higher BLOSUM matrices, for distantlyrelatedproteins higher PAM or lower BLOSUM matrices. • For database searching the commonly used matrix is BLOSUM62.
Scoring Insertions and Deletions A T G T A A T G C A T A T G T G G A A T G A A T G T - - A A T G C A T A T G T G G A A T G A insertion / deletion The creation of a gap is penalized with a negative score value.
Why Gap Penalties? Gaps not permitted Score: 0 1 GTGATAGACACAGACCGGTGGCATTGTGG 29 ||| | | ||| | || || | 1 GTGTCGGGAAGAGATAACTCCGATGGTTG 29 Match = 5 Mismatch = -4 Gaps allowed but not penalized Score: 88 1 GTG.ATAG.ACACAGA..CCGGT..GGCATTGTGG 29 ||| || | | | ||| || | | || || | 1 GTGTAT.GGA.AGAGATACC..TCCG..ATGGTTG 29
Why Gap Penalties? • The optimal alignment of two similar sequences is usually that which • maximizes the number of matches and • minimizes the number of gaps. • There is a tradeoff between these two - adding gaps reduces mismatches • Permitting the insertion of arbitrarily many gaps can lead to high scoring alignments of non-homologous sequences. • Penalizing gaps forces alignments to have relatively few gaps.
Gap Penalties • How to balance gaps with mismatches? • Gaps must get a steep penalty, or else you’ll end up with nonsense alignments. • In real sequences, muti-base (or amino acid) gaps are quit common • genetic insertion/deletion events • “Affine” gap penalties give a big penalty for each new gap, but a much smaller “gap extension” penalty.
BLOSUM vs PAM BLOSUM 62 is the default matrix in BLAST 2.0. Though it is tailored for comparisons of moderately distant proteins, it performs well in detecting closer relationships. A search for distant relatives may be more sensitive with a different matrix. BLOSUM 45 BLOSUM 62 BLOSUM 90 PAM 250 PAM 160 PAM 100 More Divergent Less Divergent 45
What do the Score and the e-value really mean? The quality of the alignment is represented by the Score (S). The score of an alignment is calculated as the sum of substitution and gap scores. Substitution scores are given by a look-up table (PAM, BLOSUM) whereas gap scores are assigned empirically . The significance of each alignment is computed as an E value (E). Expectation value. The number of different alignments with scores equivalent to or better than S that are expected to occur in a database search by chance. The lower the E value, the more significant the score. 46
Notes on E-values Low E-values suggest that sequences are homologous Can’t show non-homology Statistical significance depends on both the size of the alignments and the size of the sequence database Important consideration for comparing results across different searches E-value increases as database gets bigger E-value decreases as alignments get longer 47
Homology: Some Guidelines Similarity can be indicative of homology Generally, if two sequences are significantly similar over entire length they are likely homologous Low complexity regions can be highly similar without being homologous Homologous sequences not always highly similar 48
Suggested BLAST Cutoffs For nucleotide based searches, one should look for hits with E-values of 10-6 or less and sequence identity of 70% or more For protein based searches, one should look for hits with E-values of 10-3 or less and sequence identity of 25% or more Take Home Message: Always look at your alignments 49