Download
1 / 5
60 likes | 162 Views
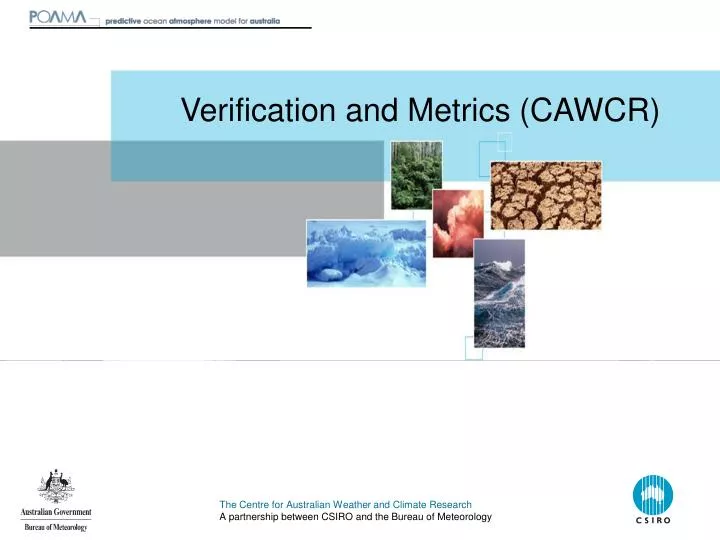
Verification and Metrics (CAWCR). Purpose – beyond forecast products. Through the application of appropriate verification methods we: Define the skill of predicting Australian climate on intra-seasonal timescales (forecast products)

E N D
Purpose – beyond forecast products • Through the application of appropriate verification methods we: • Define the skill of predicting Australian climate on intra-seasonal timescales (forecast products) • Examine the impact of initialisation; ensemble generation and model development on forecast skill • Diagnose/understand mechanisms and sources of predictability • Monitor in real-time
Variables - Precipitation (ensemble mean anomaly; tercile catagories) - Tmax (ensemble mean anomaly; tercile catagories) - Tmin (ensemble mean anomaly; tercile catagories) - SST (ensemble mean anomaly) - MJO RMM indices - Monsoon onset - Other key indices (SAM, blocking) Stratification - Season (DJF; MAM; JJA; SON) - According to state of ENSO/IOD/SAM/MJO (degree of stratification possible depends on sample size) Lead time and averaging period - Daily (usually done for prediction of indices) - Fortnight 1 - Fortnight 2 - Month 1 Reference forecast - Persistence of observed - Climatology Leave-one-year-out cross validation (verification of hindcasts) Comparing systems with different ensemble sizes
Probabilistic scores - Reliability (attributes ) diagram (including frequency histogram) Dichotomous (yes/no) forecasts Conditioned on the fc: given the fc, what was the outcome Reliability, resolution, sharpness Aggregation over region/seasons Need fairly large sample (enough cases in each bin) Choice of bin width - ROC curve Dichotomous (yes/no) forecasts Conditioned on obs: given the outcome, what was the fc Resolution (discrimination) Aggregation over region/seasons - ROC area Grid-point basis and showing significance: determined using the Mann–Whitney U statistic (Mason and Graham, 2002; Wilks, 2006). - Brier Skill Score (w.r.t. climatology) Debiased BSS (bias correction for small ensemble size) BBSd - based on weighting of indiv models for MME (not done this yet) Decomposition of BS: BSrel and BSres components “Deterministic” scores - Correlation of ensemble mean (usually use temporal rather than spatial) - RMSEensemble mean - Spread of ensemble
Examples: Rainfall over Australia (Sep/Oct/Nov, fortnight 2) Brier skill score ROC curve Reliability diagram ROC area ROC A BSres Correlation BSrel