Download
1 / 37
370 likes | 375 Views
This talk explores the needs of the data assimilation community from the observational community and vice versa, with a focus on the GODAE OceanView project. It discusses the benefits of data assimilation for marine industry applications and the importance of quality control and planning for future observation strategies.

E N D
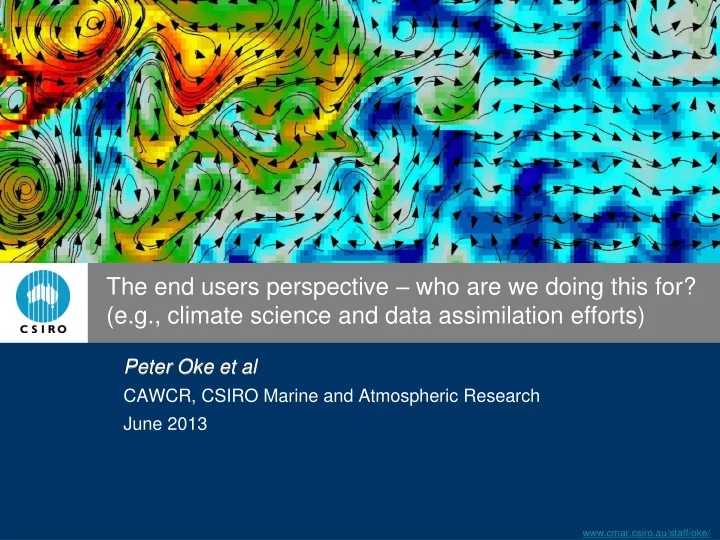
The end users perspective – who are we doing this for? (e.g., climate science and data assimilation efforts) Peter Okeet al CAWCR, CSIRO Marine and Atmospheric Research June 2013
Talk outline • What does the data assimilation community need from the observational community? • What can the data assimilation community do for the observational community? • GODAE OceanView • RTQC • Example
What does the data assimilation community need from the observational community? • Observations delivered in NRT: • QC information would be used • Error estimates: • Known instrument errors the standard deviation of errors • Unbiased observations no systematic errors
What can the data assimilation community do for the observational community? • Demonstrate impact of data: • Operational forecasts short-range (7-d), seasonal, … • Quantify the benefits to marine industry/applications: • Search & rescue; oil spill, fisheries, shipping, military support, … • Help identify quality control issues: • Feedback on what data are being excluded, and what data are developing systematic errors (bias) • Help identify emerging gaps in the GOOS • Help plan for future observation strategies
GODAE OceanView (2009- ) • Mission: Develop capabilities in operational ocean forecasting • Five Task Teams • Coastal Ocean and Shelf Seas • Inter-comparison and Validation • Marine ecosystem and prediction • Observing System Evaluation (OSEval) • Short- to medium-range coupled prediction • GODAE OceanView website: https://www.godae-oceanview.org/
GOV OSEVal-TT organisation Co-Chairs: • Peter Oke (CSIRO) • Gilles Larnicol (CLS) Core Members: • Magdalena Balmaseda (ECMWF) • Laurent Bertino (NERSC) • Gary Brassington (BoM) • Jim Cummings (NRL) • Yosuke Fujii (JMA/MRI) • Pat Hogan (NRL) • VillyKourafalou (Univ. Miami) • Daniel Lea (UKMet) • Matthew Martin (UKMet) • AvichalMehra (NOAA) • PavelSakov (NERSC) • Anthony Weaver (CERFACS) • Associate members: • Mike Bell (UKMet) • Eric Dombrowsky (Mercator) • Fabrice Hernandez (Mercator) • Eric Lindstrom (NASA) • Andreas Schiller (CSIRO)
Responses to “observing system events” • Continuation of Jason-1 data processing in inter-leaved orbit (June 2009) • UKMet and BoM provided a demonstration of the impact of Jason-1 data in inter-leaved orbit during recent outages Model-obs mis-fit Many GODAE contributions to observing system evaluation have been ad hoc Contributed by G. Brassington, BoM
Operational community needs a coordinated plan to respond to “observing system events”
NRT OSEs • Routinely run parallel forecast at operational centers and with-hold a different data each month: • Quantify the impact of each data type on forecasts • Multi-system approach
Inter-comparison participants: BoM, Coriolis, MyOcean, FNMOC, UKmet
QC inter-comparison: Recall Temperature Recall: • A measure of success • Recall = 1: is perfect • RTQC could be useful to the obs community for identifying bad floats Salinity Pressure
Inter-comparisons of intermediate-resolution reanalyses • Xue et al.
In Situ Observations Contributed by Y. Xue, NOAA/NCEP – from Saha et al. (2010)
Inter-comparison of CLIVAR systems:HC300 in Equatorial Pacific (2oS-2oN) 1993 Contributed by Y. Xue, NOAA/NCEP
Inter-comparison of CLIVAR systems:HC300 in Equatorial Atlantic (2oS-2oN) 2005 2005 Contributed by Y. Xue, NOAA/NCEP
Conclusion • Active operational ocean forecasting community that it dependent on the obs community • Data availability in NRT is important • Each forecast center undertakes RTQC that could be useful for DMQC • GODAE OceanView is motivated to “support” the obs community by demonstrating impact • Historically been ad-hoc; • Plans to make it more organised (NRT OSEs and OIS). • Many DM OSE studies have been published that demonstrate impact
Future opportunities • Help GODAE OceanView figure out how to disseminate/condense technical metrics into something that is meaningful • OSE study using DMQC-ed and RTQC-ed data – what is the benefit to a data assimilating model?
Thank you! Peter.Oke@csiro.au
how we can help them (e.g., what is important for their data assimilation efforts) and in what they can help us? • to cover the user needs from short term & longer term forecasts/predictions & climate hindcasts, and in what they also might be able to help us. • need for gridded data to initialise models (e.g., decadal predictions)? which fields? what are the requirements? • how observational fields/observations might be used to evaluate data assimilation efforts? what would be required? • how poor data quality has impacted /might impact on data assimilation efforts? or lack of uncertainties? • can assimilation efforts somehow contribute back to the QC system? (e.g., pointing to erroneous data). • Send to: • Jim Carton - carton@atmos.umd.eduSODA • Keith Haines - kh@mail.nerc-essc.ac.ukCLIVAR GSOP Co-Chair • Detlef Stammer - stammer@ifm.uni-hamburg.deGECCO • Yosuke Fujii - yfujii@mri-jma.go.jpJapanese ocean/seasonal forecasting • Matt Martin - matthew.martin@metoffice.gov.ukUKMet Ocean Forecasting • Jim Cummings - james.cummings@nrlmry.navy.milNRL ocean forecasting • Gary Brassington - g.brassington@bom.gov.auBluelink ocean forecasting • Laurent Bertino - laurent.bertino@nersc.noTOPAZ (Norwegian ocean forecasting) • Tony Lee - Tong.Lee@jpl.nasa.govECCO
Example of an OSE (with-holding XBT) • OSEs using HYCOM after the DWH Oil spill to assess the impact of XBT data • Halliwell et al. (NRL & NOAA)
Impact of P-3 Observations on Ocean Analyses • Collaboration between AOML and NRL-Stennis • NRL ran two experiments with the 1/25° regional HYCOM: 1. Assimilate all observations 2. Deny only the P3 observations • Critical issues affecting this evaluation: • Results depend on choices of model and DA scheme • Impact of update cycle • Impact of relative weighting of synthetic T,S profiles derived from altimetry vs. in-situ T,S profiles Contributed by G. Halliwell, NOAA/AOML/PhOD
No assimilation +- 1 degree No assimilation ~ 4-5 degrees RED: With P3 assimilation BLACK: No P3 assimilation No assimilation < 0.5 Contributed by G. Halliwell, NOAA/AOML/PhOD
Error Analysis, Nancy Foster T Profiles, 9 July Temperature, 30 – 360 m 20°C isotherm depth 8-10 July Contributed by G. Halliwell, NOAA/AOML/PhOD
Inter-comparisons of intermediate-resolution reanalyses • Xue et al.
In Situ Observations Contributed by Y. Xue, NOAA/NCEP – from Saha et al. (2010)
Inter-comparison of CLIVAR systems:HC300 in Equatorial Pacific (2oS-2oN) 1993 Contributed by Y. Xue, NOAA/NCEP
Inter-comparison of CLIVAR systems:HC300 in Equatorial Atlantic (2oS-2oN) 2005 2005 Contributed by Y. Xue, NOAA/NCEP
Evaluating options for altimeter constellations • Larnicol et al.
Altimeter constellations 11 x Nadir (Iridium 6 + Jason-CS +GFO2+ HYC+ S3A + S3B) 3 x Nadir 1x SWOT 1 x SWOT + 11 x Nadir 2 x SWOT Reconstruction error (% of reality signal variance) for geostrophic U and V Contributed by G. Larnicol, CLS
OSEs using JMA/MRI seasonal prediction system • Fujii et al.
Observing System Experiments (OSEs) using JMA/MRI system • Impact of TAO data decreases, and Argo data increases, as the number of Argo floats increases Difference when TAO/TRITON data are with-held Difference when Argo data are with-held Contributed by Y. Fujjii, JMA/MRI
Impact of Argo and TAO data on JMA forecast skill • With-holding Argo data degrades the skill of forecasts over 8-13 months by almost 25% in the Pacific Ocean • With-holding TAO data degrades the skill of forecasts over 1-7 months by almost 15% in the Indian Ocean. Contributed by Y. Fujjii, JMA/MRI
Oke, P., and P. Sakov: Design and Assessment of the Australian Integrated Marine Observing System • Simple method to assess the potential impact of data from moorings
Footprint of individual moorings Cabbage Patch Mooring Deep Slope Mooring