Download
1 / 26
260 likes | 598 Views
Texas Demographics and Sustainability. Texas State University November 17, 2010 San Marcos, TX. 25 Million Reasons to be Proud of Texas (among a few more). Demographic Highlights TEXAS is:

E N D
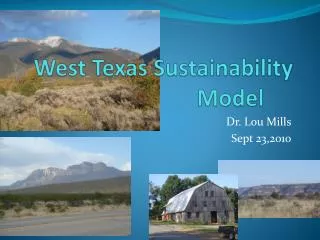
Texas Demographics and Sustainability Texas State University November 17, 2010 San Marcos, TX
25 Million Reasons to be Proud of Texas (among a few more) Demographic Highlights TEXAS is: big. The population of Texas is the second largest in the United States, approaching 25 million people (estimated population of 24.8 million people in 2009).7 young. Approximately 28% of Texas’ population is under 18 and only 10% of the population is older than 65 years.1 Webb County in Texas, has the youngest population in the U.S. with children younger than 5 comprising 12.8% of the population.7 embracing of culture and diversity. Approximately 9 million or 38% of Texans are of Hispanic descent, 2.8 million or 12% are African Americans, and 1 million or 4% are other (non-Anglo mainly of Asian descent).1 In about a decade, it is expected that Texas’ population will have more persons of Hispanic descent than any other racial or ethnic group.4 a desired place to live and work. Net in-migration to Texas accounts for almost half of the population growth in recent years.1 More than 171,900 college graduates moved into Texas each year between 2006 and 2008, placing Texas as 2nd in the Nation by this measure. urban. Texas has three of the top 10 largest cities in the Nation.3 Several of the metropolitan areas in Texas are among the most rapidly growing in the Nation.5 Data sources: 1. Texas State Data Center, Population Estimates; 2. U.S. Census Bureau, American Community Survey; 3. U.S. Census Bureau, 2000 Census; 4. Texas State Data Center, Population Projections; 5. U.S. Census Bureau, Metropolitan Statistical Area Estimates; 6. U.S. Bureau of Labor Statistics; 7. U.S. Census Bureau, Population Estimates
25 Million Reasons to be Proud of Texas (among a few more) Demographic Highlights TEXAS is: rural. Texas is the second largest state in the Nation in terms of square miles (268,601) and approximately 17% of the population lives in rural areas.1 a working state. Texas has a civilian labor force of more than twelve million workers and an unemployment rate lower than in most States.6 family oriented. Texas ranks 3rd among states for the percent of households which are married-couple families with children (24.4%).2 multigenerational. Texas ranks 3rd among states for percent of households which are multigenerational (4.5%).2 growing – fast. Texas gained more population than any other state in the last estimate year (between July 1, 2008 and July 1, 2009), adding 478,000 people.7Among cities over 100,000 population in the U.S., 4 of the 10 fastest growing areas are in Texas (2007-2008 change).7 Data sources: 1. Texas State Data Center, Population Estimates; 2. U.S. Census Bureau, American Community Survey; 3. U.S. Census Bureau, 2000 Census; 4. Texas State Data Center, Population Projections; 5. U.S. Census Bureau, Metropolitan Statistical Area Estimates; 6. U.S. Bureau of Labor Statistics; 7. U.S. Census Bureau, Population Estimates
Total Population and Components of Population Change in Texas, 1950-2009
Natural Increase in Texas(Births minus Deaths) • Birth Rate: 16.8 per 1,000 vs. 14.0 for US (2ndhighest) • Death Rate: 6.8 per 1,000 vs. 8.3 for US (5thlowest) • Natural Increase: 10.0 per 1,000 vs. 5.7 for US (3rd highest) • Texas is young: • Median Age: 33.2 vs. 36.8 for US (2ndlowest) • Texas has a high total fertility rate (Children per woman) • 2.34 vs. 2.05 for US (4th highest) Source: National Center for Health Statistics, Vital Statistics Data, 2008http://wonder.cdc.gov/
Estimated Annual Net Migration to Texas, 2000 to 2009 Source: U.S. Bureau of the Census 2009 Estimates
Estimated domestic migration (2000-2008) by county as a percentage of 2000 population Source: Population Division, U.S. Census Bureau, March 19, 2009. Map produced by the Texas State Data Center
Estimated internationalmigration (2000-2008) by county as a percentage of 2000 population Source: Population Division, U.S. Census Bureau, March 19, 2009. Map produced by the Texas State Data Center
Total Population, 2000 Census and 2009 Estimate 2000 Census 2009 Estimate Source: U.S. Census Bureau. 2000 Census Count and 2009 Population Estimates
Percent Change of Total Population in Texas Counties, 2000-2009 Population increase for Texas was almost 19% during this period Source: U.S. Census Bureau. 2000 Census Count and 2009 Population Estimates
Projected Population Growth in Texas, 2000-2040 Year Source: Texas State Data Center 2008 Population Projections
Projected Texas Population Pyramids, 2010 and 2030 0-9 COHORT IN 2010 female male 2010 2030 About 15 million more people than in 2010 Source: U.S. Census Bureau Population Projections
Energy Consumption by Source and Total Consumption per Capita, Ranked by State, 2008 Energy Consumption by Source and Total Consumption per Capita, Ranked by State, 2008 California ranked 46th in per capita consumption Arizona and Florida were 44th and 43rd Source: U.S. Energy Information Administration. State Energy Data System 2008
Residential and Commercial Per Capita Energy Consumption(in Millions of Btus) Source: U.S. Energy Information Administration.
Texas Annual Energy Consumption by Sector(in Trillions of Btus) Source: U.S. Energy Information Administration.
Megawatts of wind generated electricity, U.S., California, and Texas, 1999-2007 Source: U.S. Department of Energy
Texas megawatts of renewable electricity generated by source and year Source: U.S. Energy Information Administration.
Water supply needs by water use category for 2010-2060. (Municipal needs include water user groups classified as County-other.) Source: Texas Water Development Board
Summary • Texas’ population will continue to grow, driven by both natural increase and net migration (internal and international) • The growing population will correspondingly require water and energy. • Texas is the Nation’s leading energy consuming state and per capita, we consume more energy than most states. • Texas is a leader in renewable energy. • Water is and will continue to pose a challenge in relation to the growth of our population and economy.
Contact Office: 512-463-7659 Email: Lloyd.Potter@utsa.edu Texas State Data Center Website: TXSDC.UTSA.edu Lloyd Potter, Ph.D.