Download
1 / 38
380 likes | 478 Views
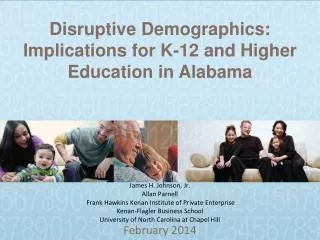
Higher Education and Demographics in Southern States and Texas. SACUBO Fort Worth, Texas May 8 , 2018. Growing States, 2010-2017. Source: U.S. Census Bureau. 2000 and 2010 Census Count, 2017 Population Estimates. . Population and components of change for select states, 2010-2017.

E N D
Higher Education and Demographics in Southern States and Texas SACUBO Fort Worth, Texas May 8, 2018
Growing States, 2010-2017 Source: U.S. Census Bureau. 2000 and 2010 Census Count, 2017 Population Estimates.
Population and components of change for select states, 2010-2017 Source: U.S. Census Bureau. 2000 and 2010 Census Count, 2017 Population Estimates.
Components of change as a percent of the population change, select states, 2010-2017 Source: U.S. Census Bureau. 2000 and 2010 Census Count, 2017 Population Estimates. * States that have percentages of over 100% for components of change have one or more component that is declining.
Estimated number of college and university students enrolled by select race and ethnicity, select states, 2016 Source: U.S. Census Bureau, American Community Survey, 2016 1-Year Sample
Percent distribution of select race and ethnic groups enrolled in college or university, select states, 2016 Source: U.S. Census Bureau, American Community Survey, 2016 1-Year Sample
Percent change in students enrolled in college and university by race/ethnicity, select states, 2010-2016 Source: U.S. Census Bureau, American Community Survey, 2010 and 2016 1-Year Samples
Number of households with children less than 18 years of age, U.S. counties, 2012-2016 Source: U.S. Census Bureau, American Community Survey, 2012-2016 5-Year Sample
Estimated number of persons enrolled in college or university, U.S. counties, 2012-2016 Source: U.S. Census Bureau, American Community Survey, 2012-2016 5-Year Sample
Estimated percent of persons living below poverty, U.S. counties, 2012-2016 Source: U.S. Census Bureau, American Community Survey, 2012-2016 5-Year Sample
Median Household Income, Texas counties, 2011-2015 Source: U.S. Census Bureau, American Community Survey, 2011-2015 5-Year Sample
Percent of the population with income below poverty, Texas counties, 2011-2015 Source: U.S. Census Bureau, American Community Survey, 2011-2015 5-Year Sample
Percent of the population aged 25 and older with a bachelor’s degree or higher, 2011-2015 Source: U.S. Census Bureau, American Community Survey, 2011-2015 5-Year Sample
Projected percent population change for select states, 2010-2040 Source: Weldon Cooper Institute for Public Service, University of Virginia, 2018, https://demographics.coopercenter.org/national-population-projections
Projected population for select states, 2010-2040 Source: Weldon Cooper Institute for Public Service, University of Virginia, 2018, https://demographics.coopercenter.org/national-population-projections
Projected population for select states, 2010-2040 Source: Weldon Cooper Institute for Public Service, University of Virginia, 2018, https://demographics.coopercenter.org/national-population-projections
Projected population for select states, 2010-2040 Source: Weldon Cooper Institute for Public Service, University of Virginia, 2018, https://demographics.coopercenter.org/national-population-projections
Projected population for select states, 2010-2040 Source: Weldon Cooper Institute for Public Service, University of Virginia, 2018, https://demographics.coopercenter.org/national-population-projections
Projected population for select states, 2010-2040 Source: Weldon Cooper Institute for Public Service, University of Virginia, 2018, https://demographics.coopercenter.org/national-population-projections
Projected median age for select states, 2010-2040 Source: Weldon Cooper Institute for Public Service, University of Virginia, 2018, https://demographics.coopercenter.org/national-population-projections
Projected change in the population aged 15-24 between 2020 and 2030 Source: Weldon Cooper Institute for Public Service, University of Virginia, 2018, https://demographics.coopercenter.org/national-population-projections
Projected percent change in the population aged 15-24 between 2020 and 2030 Source: Weldon Cooper Institute for Public Service, University of Virginia, 2018, https://demographics.coopercenter.org/national-population-projections
Projected population ages 17-19 for select Texas counties, 2015-2050 Source: Texas State Data Center 2016 Population Projections, 2000-2010 Migration Scenario Data labels for 2030 and 2050
Estimated number of persons enrolled in school as undergraduates, Texas Counties, 2011-2015 Source: U.S. Census Bureau, American Community Survey, 2011-2015 5-Year Sample
Estimated change in the number of persons enrolled in school as undergraduates, Texas Counties, 2006-2010 to 2011-2015 Source: U.S. Census Bureau, American Community Survey, 2006-2010 and 2011-2015 5-Year Samples
Public Higher Education Source: Texas Higher Education Coordinating Board. Note: Not all race/ethnicity categories that were reported are included in table.
Percent of Civilian Labor Force by Occupation, Texas, 2008, 2014 and 2014-2008 Difference Source: U.S. Census Bureau, American Community Survey, 1-Year Sample, 2008, 2010, 2014`
Earnings and Education Source: US Census Bureau, American Community Survey, 5-Year, 2015, B20004.
Educational Attainment, Persons Aged 25 Years and Older, Texas, 2011 and 2015 U.S. Census Bureau American Community Survey, 1-Year Samples, 2011 and 2015 * Years significantly different p<.05
Percent Distribution of Educational Attainment of Persons Aged 25 Years and Older, Texas, 2008, 2011, and 2015 Source: U.S. Census Bureau, American Community Survey, 1-Year Samples, 2008-2015
Educational Attainment of Persons Age 25 Years and Older by Race/Ethnicity, Texas, 2015 Source: U.S. Census Bureau, American Community Survey, 1-Year Sample, 2015
Trends in Educational Attainment of Persons in the Labor Force (25-64 Years of Age) in Texas by Race/Ethnicity – High School Graduates and Above Source: U.S. Census Bureau, American Community Survey, Public Use Micro Sample, 2001-2011
Percent of the Civilian Labor Force (ages 25-64) by Educational Attainment for 2011, 2030 Using Constant Rates, Texas These should be going DOWN These should be going UP Sources: U.S. Census Bureau, American Community Survey, 1-Year PUMS. Texas State Data Center, 2012 Vintage Population Projections, 0.5 Migration Scenario
Percent of the Civilian Labor Force (ages 25-64) by Educational Attainment for 2011, and 2030 Using Trended Rates, Texas These should be going DOWN These should be going UP Sources: U.S. Census Bureau, American Community Survey, 1-Year PUMS. Texas State Data Center, 2012 Vintage Population Projections, 0.5 Migration Scenario
Contact Lloyd Potter, Ph.D. @TexasDemography State Demographer Office: (210) 458-6530 Email: Lloyd.Potter@utsa.edu Internet: Demographics.Texas.gov