Download
1 / 8
80 likes | 158 Views
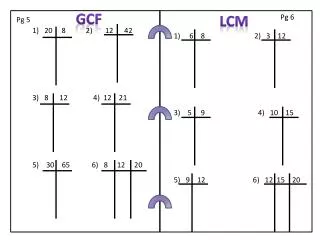
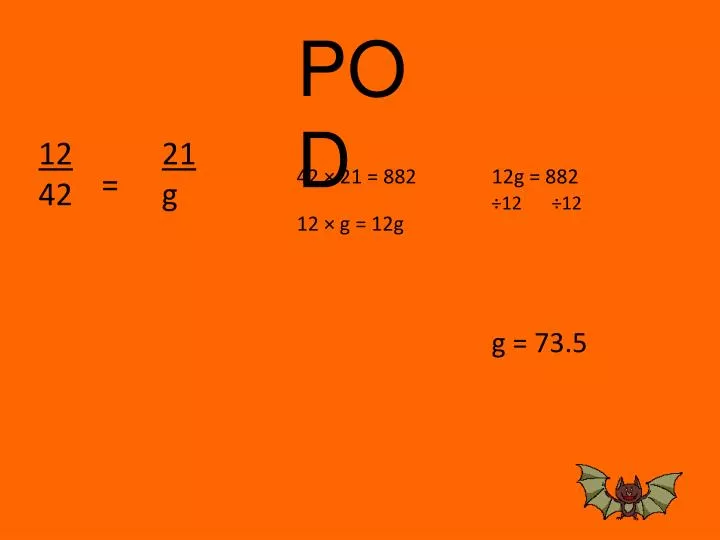
POD. 12 42. 21 g. =. 42 × 21 = 882. 12g = 882. ÷12. ÷12. 12 × g = 12g. g = 73.5. 1-7 Constant Rate of Change. A rate of change is a rate that describes how one quantity changes in relation to another.

E N D
POD 12 42 21 g = 42 × 21 = 882 12g = 882 ÷12 ÷12 12 × g = 12g g = 73.5
1-7 Constant Rate of Change A rate of change is a rate that describes how one quantity changes in relation to another.
In a linear relationship, the rate of change between any two quantities is the same. A linear relationship has a constant rate of change.
Ex: A computer programmer charges customers per line of code written. Use the data table to calculate the constant rate of change. +50 +50 +50 +1,000 +1,000 +1,000 Change in dollars Change in lines = $1,000 50 lines = $20 1 line The constant rate of change per line of programming code is $20
Ex: The graph represents the distance traveled while driving on a highway. Find the constant rate of change. What does point (0, 0) represent? It means that in 0 hours the car drove 0 miles. What does point (2, 120) represent? It means that in 2 hours the car drove 120 miles.
Ex: The graph represents the distance traveled while driving on a highway. Find the constant rate of change. To find the rate of change, pick any two points on the line, such as (0,0) and (1,60). Change in miles Change in hours (60 – 0) miles (1 – 0) hours = 60 miles 1 hour =
Ex: The graph represents the distance traveled while driving on a highway. Find the constant rate of change. To find the rate of change, pick any two points on the line, such as (3,180) and (1,60). Change in miles Change in hours (180 – 60) miles (3 – 1) hours = 120 miles 2 hours 60 miles 1 hour = =
Ex: The graph represents the distance traveled while driving on a highway. Find the constant rate of change. Pick 2 points Find the difference between the y values and the difference between the x values. Write as a rate. simplify