Download

1 / 37
380 likes | 659 Views
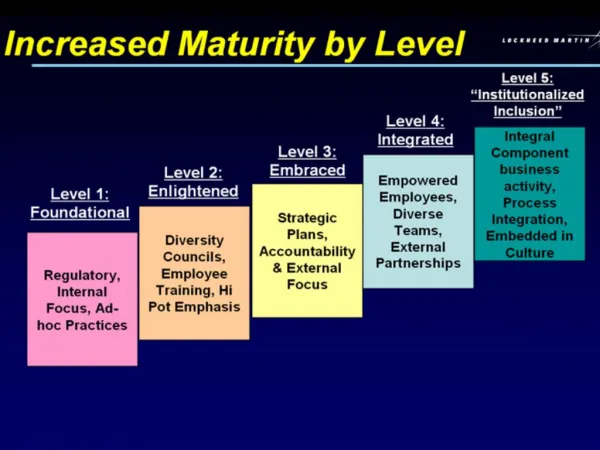
Leadership as Accountability for Learning. The Effects of Poverty, Teaching Experience, Previous Achievement and Principal Preparation Programs on Student Achievement. Judi Vanderhaar, Ph.D. Candidate Marco Muñoz, Ed.D. Robert Rodosky, Ph.D. July 7 th , 2006. Research Site.

E N D
Leadership as Accountability for Learning The Effects of Poverty, Teaching Experience, Previous Achievement and Principal Preparation Programs on Student Achievement Judi Vanderhaar, Ph.D. Candidate Marco Muñoz, Ed.D. Robert Rodosky, Ph.D. July 7th, 2006
Research Site • Jefferson Count Public Schools • 13th largest urban school district in the nation (Standard & Poor’s, 2005) • 133 schools that serve approximately 97,000 students • Leading Educational Achievement in Districts (LEAD) Grant [funded by Wallace Foundation] • Attract an able pool of principal candidates • Strengthen ability of school leaders to impact student achievement
Previous Research • Severe shortage of qualified public school administrators(Whitaker, 2001) • High stakes school reform has increased administrator responsibilities(Murphy, 1991; Murphy & Beck) • Implementing school reform to improve student achievement requires excellent leadership(Greenfield, 1995; Hallinger & Heck, 1996)
Previous Research continued • Instructional leadership behaviors are critical to Principals’ impact on achievement (Quinn, 2002) • 21 specific leadership responsibilities are significantly correlated with student achievement(Walters, Marzano, & McNulty, 2003)
Previous Research continued • The effect of concentrated school poverty extend beyond the effect of the individual student condition (Banks, 2001) • High Poverty Schools must struggle with the challenges posed by high teacher turnover (Orfield & Lee, 2005) • Student achievement showed sharp declines when the school poverty concentration rose above 40% (Lippman, Burns, & McArther, 1996)
Contextual Factors • Theoretical base • Schools as loosely coupled systems • Many agents make up system • Slow diffusion of initiatives (Weick, 1982) • School level • Concentrated poverty • Avg. teachers teaching experience • LEAD Preparation programs • Adjusting over years • Lack of standardization
Conceptual Framework • Antecedents with Mediated-Effects Model(Boyan, 1988; Hallinger & Murphy, 1985) Antecedents Context Achievement Principal Gender & Race School Poverty Avg.Teaching Experience Teaching Experience Principal as school leader Student Achievement University Preparation Principal Tenure Previous Achievement District Preparation
Research Questions Do CATS achievement test scores & gains differ by: • Principals’ demographics (i.e.,race, gender) and teaching experience? • Number of years in current location (i.e., principal tenure)? • School type (i.e.,schoollevel, Title I status)? • School contextual factors (i.e.,poverty quartiles, avg. years of teachers teaching experience)?
Research Questions continued Do CATS achievement test scores & gains differ by: 5. District preparation programs (i.e., IDEAS, PFT, Internship, Combination)? 6. University preparation programs (i.e., University of Louisville, Other)? 7. What are the predictors of CATS achievement scores (i.e., criterion- and norm-referenced tests)?
Poverty Quartiles • Low 11.8% - 42.3% • Medium-Low 42.4% - 62.7% • Medium-High 62.8% - 76.8% • High 76.9% - 92.1%
Method • Participants: All Principals in location for 2+ years (N = 91) [70% of all JCPS principals in analyses] Demographics by School Poverty
Method continued • Participants continued School Factors by School Poverty
Method continued • Participants continued Preparation Programs by School Poverty
Method continued • Data Independent Variables
Method continued • Data continued Dependent Variables
Method continued • Data continued Additional Variables
Method continued • Design and Procedures • Exploratory study with descriptive and inferential statistics • Descriptive: Counts, Percent, Mean, and Standard deviation • Inferential: comparative and correlational analyses
Method continued • Design and Procedures continued • Comparative:ANOVA to determine significant differences between groups • Bonferroni Adjustment used to reduce type I error(Stevens, 1999) with pvalue set to <.003. • Correlations: OLS hierarchical regression to determine predictors of achievement • Number of predictors based on number of cases in study sample (Stevens, 1999)
Results • RQ 1. Demographics (gender, race) and Teaching Experience: • No statistically significant difference on all measures between: • Male and female principals • Minority and white principals • Teaching experience of principals (i.e. 3-8 years, 9-14 years, 15+ years)
Results continued • RQ 2. Number of years principal in location (principal tenure): • Statistically significant difference on absolute scores between 4-6 yrs and 7+ yrs. on all measures.
Results continued • RQ 3. Type of school (Level, Title I): • School Level • Significant difference between Elementary and Middle for last year gain in the Academic Index (F(2,88) = 8.21, p = .002) and in the Accountability Index (F(2,88) = 5.31, p = .001). • Significant difference between Elem. and High for last year gain in the Academic Index (F(2,88) = 8.21, p = .002),
Results continued • Level figures
Results continued • RQ 3. Type of school (Level, Title I) continued: • Title I status • Sig. difference between Title I and non Title I schools on all 2005 Scores • No sig. difference between Title I and non Title I schools on last year gain or avg. gain for principal tenure
Results continued • Title I figure
Results continued • RQ 4. Contextual Factors (Poverty quartiles, Avg. teaching experience): • F/R quartiles • Sig. difference between low and med-low, med-high, and high on all absolute 2005 scores. • Sig. difference between med-low and high on all absolute scores (except math).
Results continued • F/R Quartile figure
Results continued • RQ 4. Contextual Factors (Poverty, Avg. teaching experience) continued: • Avg. teaching experience • Significant difference between 5-9 and 13+, and 10-12 and 13+ on all absolute 2005 scores. • Significant difference between 5-9 and 10-12 on 2005 CTBS.
Results continued • Average Teaching Experience figure
Results continued • RQ 5. District Preparation Programs (IDEAS, PFT, Internship, Combination): • No statistically significant difference on all measures between: • IDEAS participants and non Ideas Participants • PFT participants and non PFT participants • Internship participants and No internship • Combination participants and no combination or no participation
Results continued • RQ 6. University preparation programs: • University of Louisville is the primary provider of JCPS principals • No statistically significant difference on all measures between: • University of Louisville vs. all other universities
Results continued • RQ 7. Predictors of CATS achievement scores (criterion and norm referenced tests): • Criterion referenced tests (KCCT)
Results continued • RQ 7 continued. • Norm referenced test (CTBS)
Results continued • RQ 7. continued • Regression Results (Criterion Referenced)
Results continued • RQ 7. continued • Regression results (norm referenced)
Discussion • Implications for Practice • Recruitment Targets • Differentiated by school level • Male leaders (i.e., elementary & middle) • Minority leaders (all levels) • College & District Preparation Program curriculum • Standardized and stable • Prepare for multiple contexts • Type of leadership change (Marzano et al., 2005) • Principal Tenure • “It takes three years to achieve change in student performance” (Fullan, 2000)
Discussion continued • Implications for Practice continued • Context Matters! • Previous school achievement • Previous achievement significantly impacts achievement (Roeder, 1999) • School poverty • “Student achievement declines sharply when poverty concentration rises above 40%” (Lippman, Burns & McArther, 1996) • Average teaching experience of teachers • High poverty schools have lower average teacher teaching experience (Darling-Hammond,1997). High teacher turnover due to teacher transfer policy.
Discussion continued • Future Research • Conceptual Model • Incorporates direct effect model features; Principal can be viewed as both IV and DV (Pittner, 1988) • Statistical Analyses • More advanced statistical methods (i.e., HLM, SEM) may produce other unique findings (Raudenbush & Bryk, 2001) • Stable “treatment” (preparation programs) • Minimization of unreliability of treatment implementation (Shaddish, Cook & Campbell,2002)