Download

1 / 7
90 likes | 275 Views
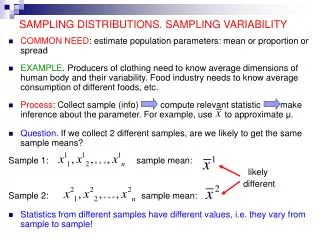
Sampling Variability. Every Sample taken from a population gives different measures(statistics/parameters) Usually only one sample is looked at to get information about a population. Measures taken from a sample are the MEDIAN MEAN INTERQUARTILE RANGE (IQR = UQ – LQ)

E N D
Every Sample taken from a population gives different measures(statistics/parameters) • Usually only one sample is looked at to get information about a population
Measures taken from a sample are the • MEDIAN • MEAN • INTERQUARTILE RANGE (IQR = UQ – LQ) • MINIMUM,MAXIMUM VALUES and RANGE
The mean median and IQR of different samples from the same population are similar to each other • These measures are likely to give a good estimate of the population measures.
The minimum, maximum and range of different samples are NOT similar to each other • They are UNLIKELY to give good estimates of the minimum, maximum or range of the population.
The Shape of samples and any unusual features may not be representative of the shape and unusual features of the population.
As sample size increases, SAMPLING VARIABILITY decreases so estimates of the population parameters/statistics/measures are better.