Download
1 / 11
110 likes | 351 Views
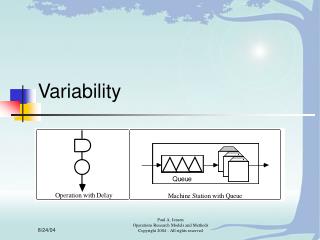
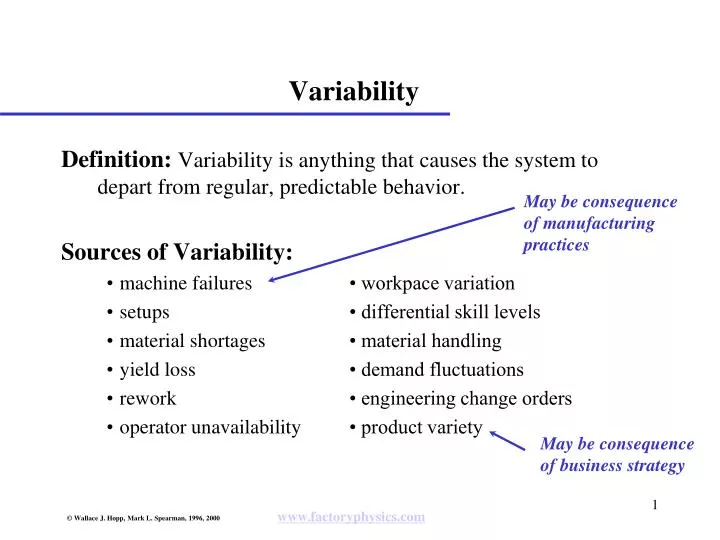
May be consequence of manufacturing practices. May be consequence of business strategy. Variability. Definition: Variability is anything that causes the system to depart from regular, predictable behavior. Sources of Variability: machine failures • workpace variation

E N D
May be consequence of manufacturing practices May be consequence of business strategy Variability Definition: Variability is anything that causes the system to depart from regular, predictable behavior. Sources of Variability: • machine failures • workpace variation • setups • differential skill levels • material shortages • material handling • yield loss • demand fluctuations • rework • engineering change orders • operator unavailability • product variety
Measuring Process Variability Note: we often use the “squared coefficient of variation” (SCV),ce2
Flow Variability Process Variability is bad enough… • Inflates FT • Inflates WIP • Forces lower utilization of capacity But, variability also propagates… • Causes uneven arrivals downstream • Inflates FT and WIP at other stations • Forces lower utilization of capacity throughout the line
Illustrating Flow Variability Low variability arrivals t High variability arrivals t
HV LV LV HV HV HV LV LV LV LV HV HV Propagation of Variability – Low Utilization Station Conclusion: flow variability out of a low utilization station is determined primarily by flow variability into that station.
HV LV HV HV HV HV LV LV LV LV HV LV Propagation of Variability – High Utilization Station Conclusion: flow variability out of a high utilization station is determined primarily by process variability at that station.
Propagation of Variability ce2(i) Single Machine Station: where u is the station utilization given by u = rate Multi-Machine Station: where m is the number of (identical) machines and ca2(i) cd2(i) = ca2(i+1) i i+1 departure var depends on arrival var and process var
Kendall's Classification A/B/C A: arrival process B: service process C: number of machines M: exponential (Markovian) distribution G: completely general distribution D: constant (deterministic) distribution. B A C Queue Server
The G/G/1 Queue Formula: Observations: • Useful model of single machine workstations • Separate terms for variability, utilization, process time. • FTq (and other measures) increase with ca2 and ce2 • Flow variability, process variability, or both can combine to inflate queue time. • Variability causes congestion!
Seeking Out Variability General Strategies: • look for long queues (Little's law) • look for blocking • focus on high utilization resources • consider both flow and process variability • ask “why” five times Specific Targets: • equipment failures • setups • rework • operator pacing • anything that prevents regular arrivals and process times